

Chevron reports Bakken midstream restructuring: CVX gains momentum

Chevron (CVX) stock is trading at $235.63, up 1.8% for the day. The price currently sits above its key moving averages, highlighting strong short- and long-term momentum.
 215.06
232.85
Highlights
- Chevron reported adjusted earnings of about $10.4 billion and nearly $14.2 billion in free cash flow for Q3 2026 with low net leverage.
- New investments in Venezuela, an oil discovery in Angola, and a restructuring of Bakken midstream operations support ongoing portfolio growth and efficiency.
- Shares of Chevron closed at $235.63 after a 1.8% rise, with bullish trend signals prevailing but overbought technical indicators suggesting possible short-term consolidation between $231.7 and $239.56.
Portfolio expansion and governance shifts spur buying flows
Chevron’s strong Q3 2026 results, including adjusted earnings of about $10.4 billion and nearly $14.2 billion in free cash flow with low net leverage, highlight fundamental drivers supporting recent buying activity, according to Yahoo Finance. In addition, Chevron’s announced investments in Venezuela, its new discovery in Angola, and a pending cost-saving restructuring of Bakken midstream operations signal continued portfolio growth and enhanced operating efficiency. Longer-term, the appointment of Siva Barnwell Adams as corporate secretary and chief governance officer, reported by Gurufocus, reflects ongoing focus on governance and leadership continuity.
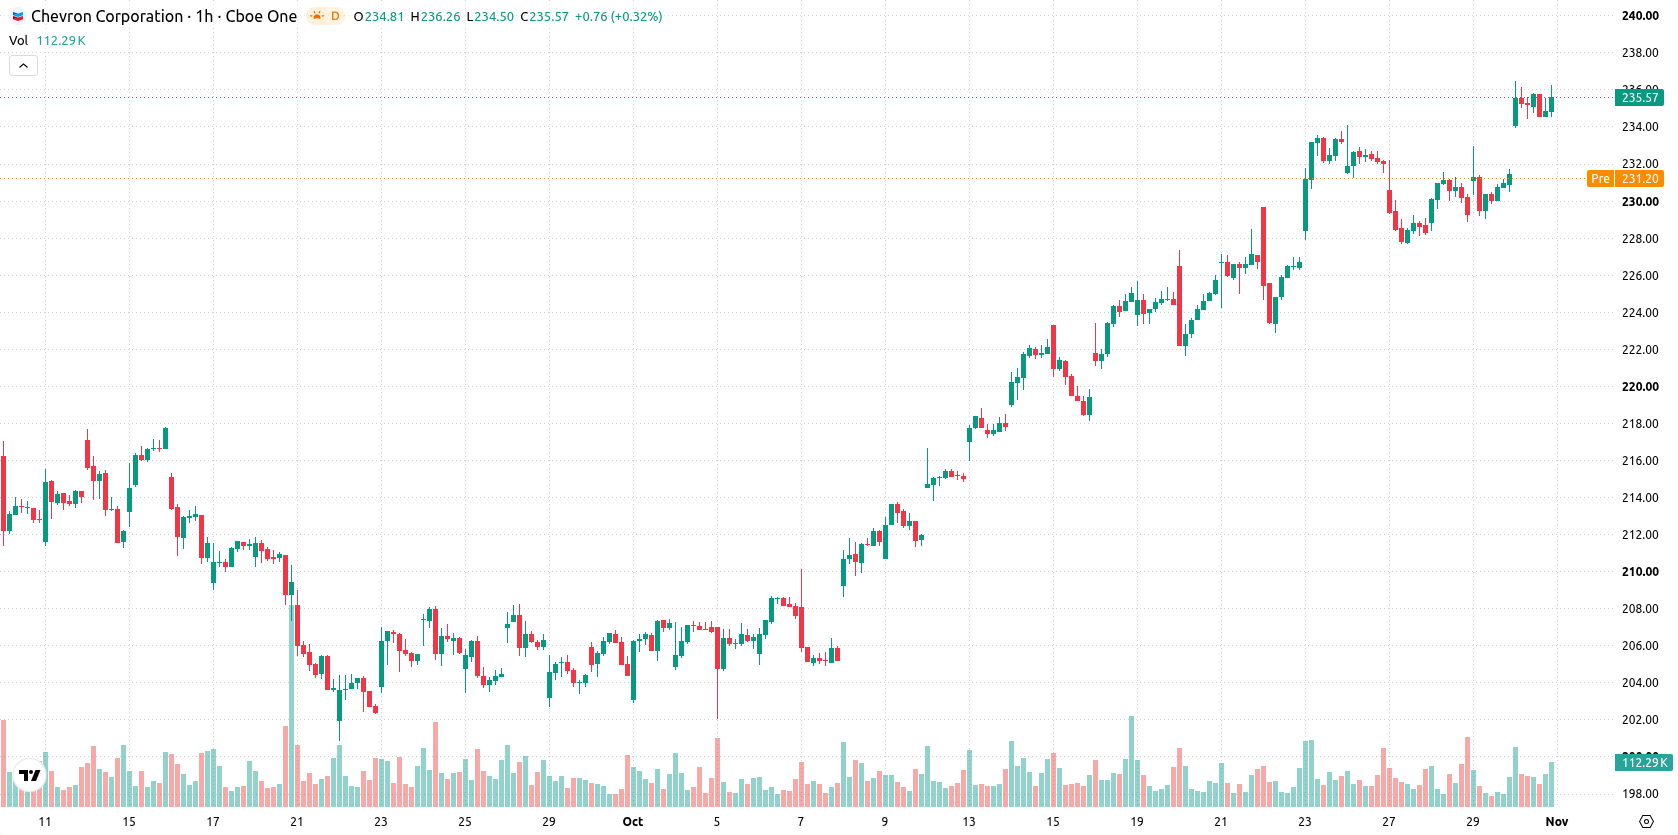
Bullish momentum outpaces oscillators as overbought signals grow
On the hourly chart, CVX is trading above the MA-20 at $232.19 and MA-50 at $230.69, as well as the long-term MA-200 set at $193.33. The nearest support sits at the Ichimoku Kijun level of $232.06. Bullish momentum signals are confirmed by both MACD and ADX, while the RSI at 65.91 signals a buy and is approaching overbought territory. Oscillators, including Stoch RSI, CCI, and Bull/Bear Power, all reflect overbought conditions, with Bull/Bear Power confirming strong intraday buying dominance. The Awesome Oscillator remains neutral, highlighting divergence between robust trend momentum and overextended oscillators.
Range-bound outlook persists as breakout and pullback risks build
In the short term, CVX is expected to consolidate within a typical volatility band of $231.7 to $239.56. The baseline scenario favors range-bound trading supported by ongoing bullish momentum. A breakout above near-term resistance could trigger further gains, while a close below immediate support at $232.06 would increase risk of a short-term pullback.
Earlier, analysts noted that elevated fuel costs and global supply constraints were increasing both operating pressures and profit opportunities for large Texas-based energy companies such as Chevron. Building on this, Chevron’s robust earnings alongside new portfolio expansions and operational efficiencies present an evolving landscape where a sustained break above the $239.56 resistance could serve as the next technical signal for bullish continuation.










-
 Afghanistan
-
 Albania
-
 Algeria
-
 Angola
-
 Argentina
-
 Armenia
-
 Australia
-
 Austria
-
 Azerbaijan
-
 Bahamas
-
 Bahrain
-
 Bangladesh
-
 Belarus
-
 Belgium
-
 Bolivia
-
 Botswana
-
 Brazil
-
 Brunei
-
 Bulgaria
-
 Cambodia
-
 Cameroon
-
 Canada
-
 Chile
-
 China
-
 Colombia
-
 Congo
-
 Costa Rica
-
 Cote d'Ivoire
-
 Croatia
-
 Cuba
-
 Cyprus
-
 Czechia
-
 DR Congo
-
 Denmark
-
 Dominican Republic
-
 Ecuador
-
 Egypt
-
 El Salvador
-
 Estonia
-
 Eswatini
-
 Ethiopia
-
 Finland
-
 France
-
 Georgia
-
 Germany
-
 Ghana
-
 Greece
-
 Haiti
-
 Hong Kong
-
 Hungary
-
 India
-
 Indonesia
-
 Iran, Islamic republic
-
 Iraq
-
 Ireland
-
 Israel
-
 Italy
-
 Jamaica
-
 Japan
-
 Jordan
-
 Kazakhstan
-
 Kenya
-
 Korea
-
 Kuwait
-
 Kyrgyzstan
-
 Laos
-
 Latvia
-
 Lebanon
-
 Lesotho
-
 Libya
-
 Lithuania
-
 Luxembourg
-
 Madagascar
-
 Malaysia
-
 Malta
-
 Mauritius
-
 Mexico
-
 Moldova
-
 Mongolia
-
 Montenegro
-
 Morocco
-
 Mozambique
-
 Myanmar
-
 Namibia
-
 Nepal
-
 Netherlands
-
 New Zealand
-
 Nigeria
-
 North Macedonia
-
 Norway
-
 Oman
-
 Pakistan
-
 Palestine
-
 Panama
-
 Papua New Guinea
-
 Paraguay
-
 Peru
-
 Philippines
-
 Poland
-
 Portugal
-
 Puerto Rico
-
 Qatar
-
 Reunion
-
 Romania
-
 Rwanda
-
 Saudi Arabia
-
 Serbia
-
 Singapore
-
 Slovakia
-
 Slovenia
-
 Somalia
-
 South Africa
-
 Spain
-
 Sri Lanka
-
 Sweden
-
 Switzerland
-
 Syria
-
 Taiwan
-
 Tajikistan
-
 Tanzania
-
 Thailand
-
 Trinidad and Tobago
-
 Tunisia
-
 Turkey
-
 UAE
-
 Uganda
-
 Ukraine
-
 United Kingdom
-
United States
-
 Uruguay
-
 Uzbekistan
-
 Venezuela
-
 Vietnam
-
 Yemen
-
 Zambia
-
 Zimbabwe
- Forex
- Crypto












