

Will Chevron stock consolidate or break $207.11 support as seller pressure builds?

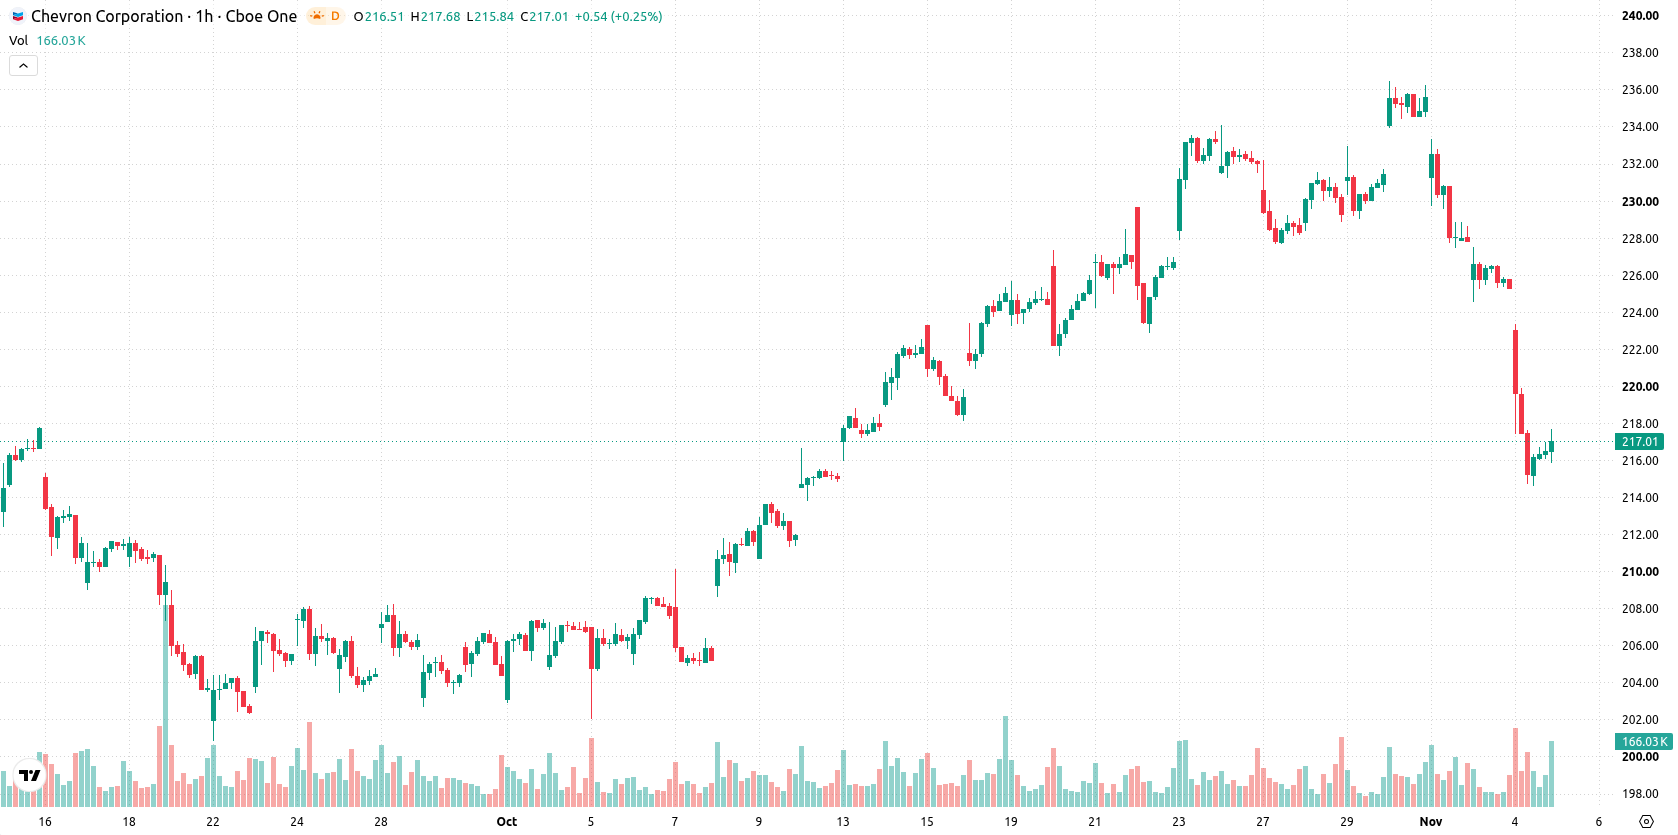
Chevron (CVX) stock is trading at $216.85, down 3.74% on the day. The price is currently positioned below both its short- and medium-term moving averages, but remains above long-term trend support, reflecting nearby downside pressure within a broader underlying support zone.
 218.25
219.88
Highlights
- Chevron reported third-quarter earnings of $5.28 per share and revenue of $65.24 billion, beating consensus estimates.
- Net margin reached 11.56%, with operational efficiency supporting a stronger long-term fundamental outlook for Chevron stock.
- Shares of Chevron traded at $216.85, declining 3.74% as technical signals indicate strong short-term downside with a probable range of $207.11 to $226.59.
Profit beat offsets operational gains amid persistent market weakness
Chevron reported third-quarter earnings of $5.28 per share on October 30, 2026, outperforming consensus estimates, with revenue reaching $65.24 billion and a net margin of 11.56%, according to Defenseworld. The stronger-than-expected profitability highlighted Chevron's continued operational efficiency and improved its fundamental outlook for long-term investors. Nevertheless, these positive results were accompanied by ongoing pressure in the market, as reflected in the stock's immediate price action.
Oversold momentum persists as sellers test major support zone
The price of CVX is situated below the MA-20 and MA-50 on the hourly chart, with the MA-200 providing a zone of longer-term support in the background. The Ichimoku Kijun level at $225.43 serves as immediate resistance, while the notable intraday support level stands at $207.11; the upper bound of the current trading corridor is $226.59. Momentum indicators such as MACD and ADX are pointing to sell signals, with Bull/Bear Power also negative, confirming active seller presence during the session. RSI remains in oversold territory, while Stochastic RSI and CCI are neutral. The Awesome Oscillator is also neutral, indicating a lack of strong trend confirmation. A divergence between the sharply oversold RSI and other oscillators signals a developing oversold condition amid continuing bearish momentum.
Sideways trading likely as downside risk outweighs upside prospects
In the coming 2–3 trading days, CVX is expected to fluctuate within a $207.11–$226.59 volatility band relative to current levels. The likelihood of an upside breakout is viewed as very low, while the odds of continued downward movement remain high. The baseline scenario suggests price will consolidate and trade sideways within this corridor. A bullish scenario would require a decisive break above $225.43 resistance, while a bearish move may accelerate if the price falls through support at $207.11.
Earlier, analysts noted that Chevron's technical setup showed near-term vulnerability despite long-term support, with downside risks elevated by weak momentum and significant ETF outflows. The current analysis reinforces these concerns, highlighting sustained bearish momentum and advising close attention to the $207.11 support level as a trigger for potential acceleration in selling pressure.






Latest Chevron News





-
 Afghanistan
-
 Albania
-
 Algeria
-
 Angola
-
 Argentina
-
 Armenia
-
 Australia
-
 Austria
-
 Azerbaijan
-
 Bahamas
-
 Bahrain
-
 Bangladesh
-
 Belarus
-
 Belgium
-
 Bolivia
-
 Botswana
-
 Brazil
-
 Brunei
-
 Bulgaria
-
 Cambodia
-
 Cameroon
-
 Canada
-
 Chile
-
 China
-
 Colombia
-
 Congo
-
 Costa Rica
-
 Cote d'Ivoire
-
 Croatia
-
 Cuba
-
 Cyprus
-
 Czechia
-
 DR Congo
-
 Denmark
-
 Dominican Republic
-
 Ecuador
-
 Egypt
-
 El Salvador
-
 Estonia
-
 Eswatini
-
 Ethiopia
-
 Finland
-
 France
-
 Georgia
-
 Germany
-
 Ghana
-
 Greece
-
 Haiti
-
 Hong Kong
-
 Hungary
-
 India
-
 Indonesia
-
 Iran, Islamic republic
-
 Iraq
-
 Ireland
-
 Israel
-
 Italy
-
 Jamaica
-
 Japan
-
 Jordan
-
 Kazakhstan
-
 Kenya
-
 Korea
-
 Kuwait
-
 Kyrgyzstan
-
 Laos
-
 Latvia
-
 Lebanon
-
 Lesotho
-
 Libya
-
 Lithuania
-
 Luxembourg
-
 Madagascar
-
 Malaysia
-
 Malta
-
 Mauritius
-
 Mexico
-
 Moldova
-
 Mongolia
-
 Montenegro
-
 Morocco
-
 Mozambique
-
 Myanmar
-
 Namibia
-
 Nepal
-
 Netherlands
-
 New Zealand
-
 Nigeria
-
 North Macedonia
-
 Norway
-
 Oman
-
 Pakistan
-
 Palestine
-
 Panama
-
 Papua New Guinea
-
 Paraguay
-
 Peru
-
 Philippines
-
 Poland
-
 Portugal
-
 Puerto Rico
-
 Qatar
-
 Reunion
-
 Romania
-
 Rwanda
-
 Saudi Arabia
-
 Serbia
-
 Singapore
-
 Slovakia
-
 Slovenia
-
 Somalia
-
 South Africa
-
 Spain
-
 Sri Lanka
-
 Sweden
-
 Switzerland
-
 Syria
-
 Taiwan
-
 Tajikistan
-
 Tanzania
-
 Thailand
-
 Trinidad and Tobago
-
 Tunisia
-
 Turkey
-
 UAE
-
 Uganda
-
 Ukraine
-
 United Kingdom
-
United States
-
 Uruguay
-
 Uzbekistan
-
 Venezuela
-
 Vietnam
-
 Yemen
-
 Zambia
-
 Zimbabwe
- Forex
- Crypto












