

Comcast institutional buying increases: Can CMCSA extend its upward move?

Comcast (CMCSA) stock is trading at $24.89, gaining 5.15% in today’s session. The price currently sits above its key short- and medium-term moving averages, reflecting a positive intraday bias.
 24.74
25.26
Highlights
- ARGA Investment Management LP acquired over one million shares of Comcast in the third quarter, driving substantial institutional demand.
- International Assets Investment Management LLC expanded its Comcast position by 177.9%, and Associated Banc Corp entered with 340,834 new shares, producing a net increase in institutional ownership.
- Comcast stock trades above key short- and medium-term averages with strong momentum indicators, and is projected to range from $23.4 to $25.88 in the next 2 to 3 days.
Institutional inflows offset partial exits as net buying momentum builds
ARGA Investment Management LP’s acquisition of over one million CMCSA shares in the third quarter, as reported by MarketBeat, adds a significant institutional demand catalyst to the recent price action. Additional inflows from International Assets Investment Management LLC, which expanded its holdings by 177.9%, and Associated Banc Corp, entering with 340,834 new shares, further amplify the stock’s attractiveness to large-scale investors, providing net buying support and counteracting potential downward pressure. Offsetting these bullish flows was Markel Group Inc., which reduced its position by over 500,000 shares in the same period, yet the overall effect is a net increase in institutional ownership that aligns with the current buying momentum in the stock.
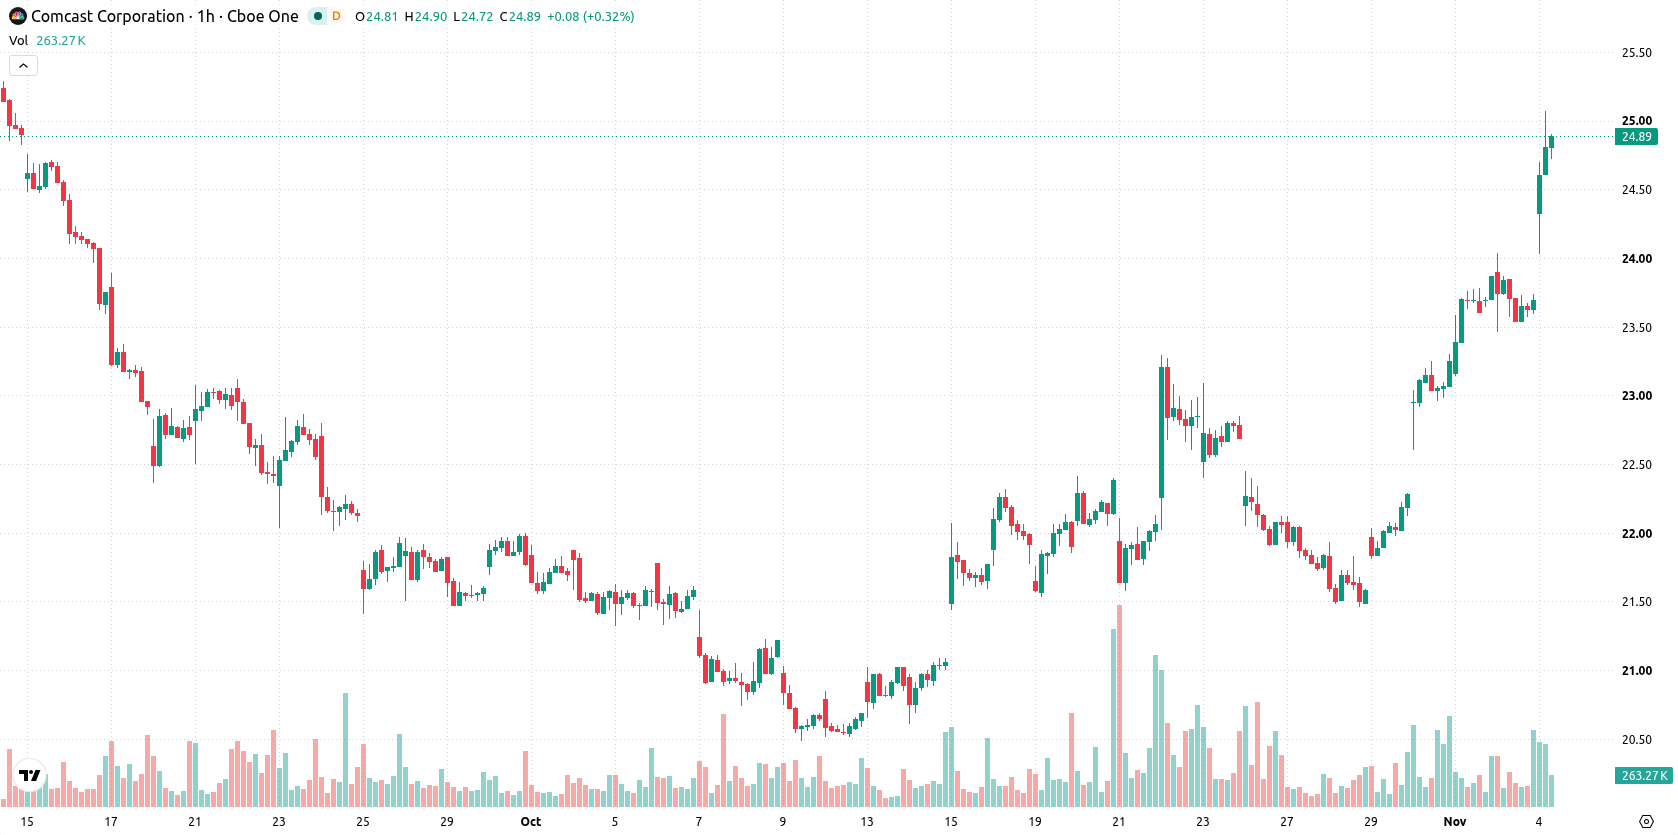
Mixed technical momentum as price sits above short-term support
On the hourly chart, CMCSA is trading above the MA-20 and MA-50, but remains below the MA-200, delineating mixed signals across timeframes. Immediate support is found at the Ichimoku Kijun level of $22.97. Momentum indicators provide a mixed technical setup: the MACD and ADX are both generating buy signals, while RSI and CCI are neutral and the Stochastic RSI indicates oversold conditions. Bull/Bear Power stands mildly positive at 0.13 and the Awesome Oscillator remains neutral, pointing to moderate buyer dominance in intraday trading.
High odds of breakout as price nears top of trading band
Over the next two to three trading days, CMCSA is expected to remain within a volatility band defined by $23.4 on the downside and $25.88 on the upside. The baseline scenario projects the price holding within this range. Should the price break above $25.88, there is potential for a further rally, while a close below $23.4 would likely trigger additional decline. The probability of an upward move is assessed as very high given the current technical and flow setup.
Earlier, analysts noted that Comcast’s operational outperformance and technical strength were positioning the stock for potential upside. The current increase in institutional accumulation alongside prevailing technical signals reinforces the bullish scenario, with traders advised to monitor $25.88 as the key breakout level in the near term.









-
 Afghanistan
-
 Albania
-
 Algeria
-
 Angola
-
 Argentina
-
 Armenia
-
 Australia
-
 Austria
-
 Azerbaijan
-
 Bahamas
-
 Bahrain
-
 Bangladesh
-
 Belarus
-
 Belgium
-
 Bolivia
-
 Botswana
-
 Brazil
-
 Brunei
-
 Bulgaria
-
 Cambodia
-
 Cameroon
-
 Canada
-
 Chile
-
 China
-
 Colombia
-
 Congo
-
 Costa Rica
-
 Cote d'Ivoire
-
 Croatia
-
 Cuba
-
 Cyprus
-
 Czechia
-
 DR Congo
-
 Denmark
-
 Dominican Republic
-
 Ecuador
-
 Egypt
-
 El Salvador
-
 Estonia
-
 Eswatini
-
 Ethiopia
-
 Finland
-
 France
-
 Georgia
-
 Germany
-
 Ghana
-
 Greece
-
 Haiti
-
 Hong Kong
-
 Hungary
-
 India
-
 Indonesia
-
 Iran, Islamic republic
-
 Iraq
-
 Ireland
-
 Israel
-
 Italy
-
 Jamaica
-
 Japan
-
 Jordan
-
 Kazakhstan
-
 Kenya
-
 Korea
-
 Kuwait
-
 Kyrgyzstan
-
 Laos
-
 Latvia
-
 Lebanon
-
 Lesotho
-
 Libya
-
 Lithuania
-
 Luxembourg
-
 Madagascar
-
 Malaysia
-
 Malta
-
 Mauritius
-
 Mexico
-
 Moldova
-
 Mongolia
-
 Montenegro
-
 Morocco
-
 Mozambique
-
 Myanmar
-
 Namibia
-
 Nepal
-
 Netherlands
-
 New Zealand
-
 Nigeria
-
 North Macedonia
-
 Norway
-
 Oman
-
 Pakistan
-
 Palestine
-
 Panama
-
 Papua New Guinea
-
 Paraguay
-
 Peru
-
 Philippines
-
 Poland
-
 Portugal
-
 Puerto Rico
-
 Qatar
-
 Reunion
-
 Romania
-
 Rwanda
-
 Saudi Arabia
-
 Serbia
-
 Singapore
-
 Slovakia
-
 Slovenia
-
 Somalia
-
 South Africa
-
 Spain
-
 Sri Lanka
-
 Sweden
-
 Switzerland
-
 Syria
-
 Taiwan
-
 Tajikistan
-
 Tanzania
-
 Thailand
-
 Trinidad and Tobago
-
 Tunisia
-
 Turkey
-
 UAE
-
 Uganda
-
 Ukraine
-
 United Kingdom
-
United States
-
 Uruguay
-
 Uzbekistan
-
 Venezuela
-
 Vietnam
-
 Yemen
-
 Zambia
-
 Zimbabwe
- Forex
- Crypto












