

Dutch Bros Q3 results outpace estimates: Can BROS sustain stability despite insider selling?

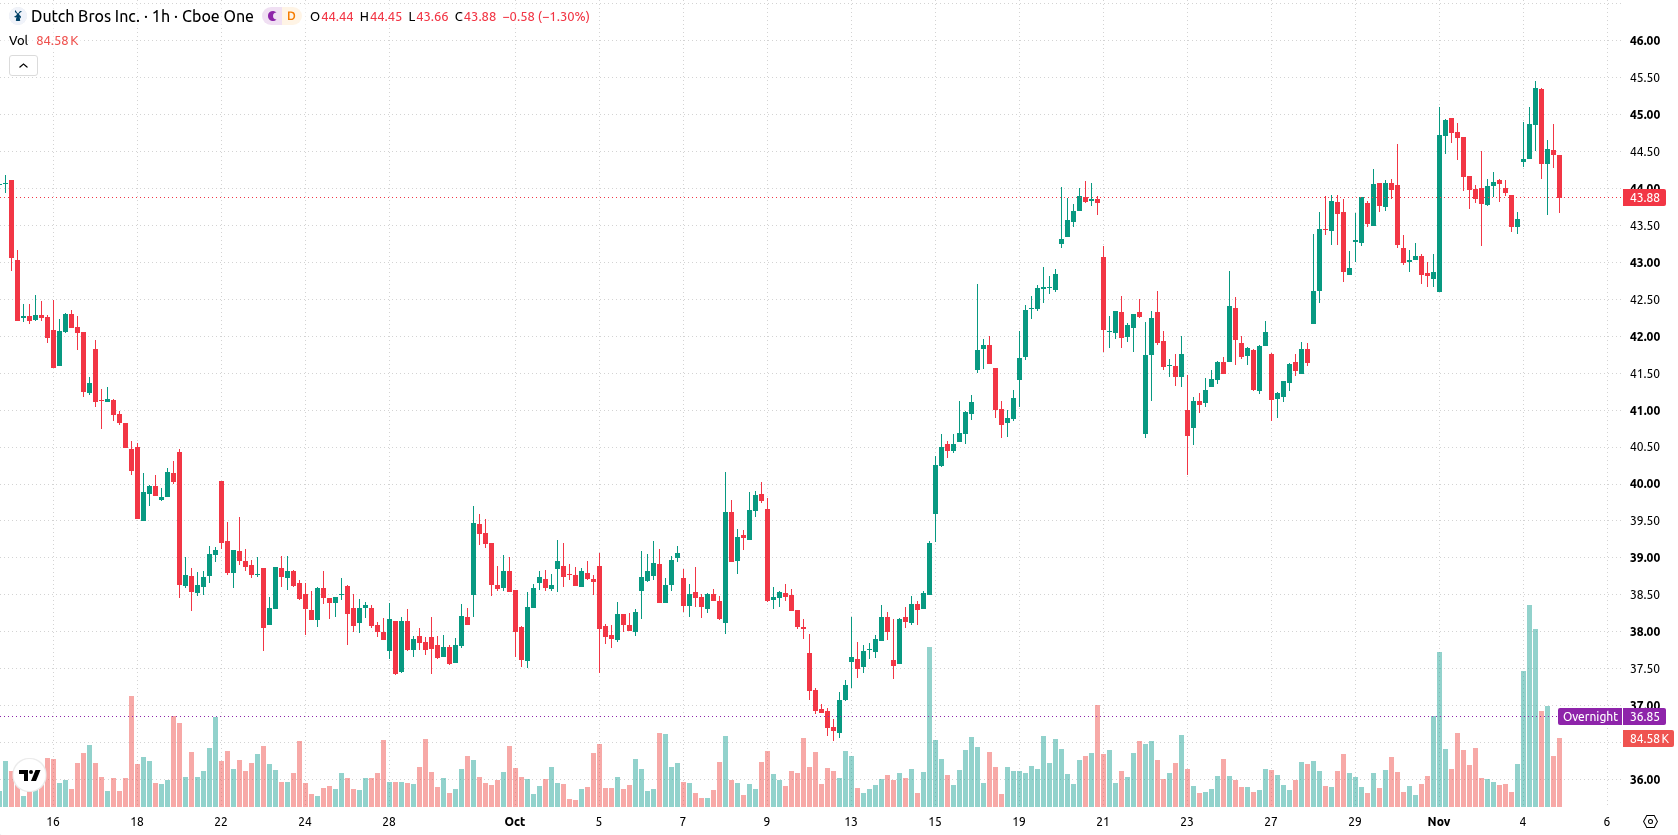
Dutch Bros Inc. (BROS) stock is trading at $43.88 with a modest gain on the day. The price is currently positioned below its key short-term moving average, but remains above its medium-term marker, reflecting some near-term caution while maintaining broader stability.
 36.00
36.52
Highlights
- Dutch Bros stock rose as revenue increased 30% to $549.8 million and adjusted EBITDA advanced 29.6% to $101.1 million for the third quarter of 2026.
- Same-shop sales gained 5.4% with 48 new locations opened, but the full-year outlook missed consensus and insiders sold shares recently.
- BROS stock trades below short-term resistance with technical signals mixed; expected to fluctuate between $42.65 and $45.11 in the near term.
Mixed sentiment after strong results and insider sales disclosures
Dutch Bros posted strong third-quarter 2026 results with revenue jumping 30% year-over-year to $549.8 million, accompanied by higher profitability as diluted EPS rose to $0.20 and adjusted EBITDA advanced 29.6% to $101.1 million, according to Investors Dutchbros. Same-shop sales gained 5.4%, while the company expanded its footprint by opening 48 new locations, reaching 1,273 shops as of September 30, 2026. Despite quarterly figures outpacing estimates, mixed sentiment emerged as the full-year outlook missed consensus, and notable insider selling from Executive Chairman Travis Boersma and DM Trust Aggregator was disclosed by Stocktwits and Investing.com, potentially shaping short-term supply dynamics.
Momentum signals mixed as price faces near-term resistance
Technically, BROS is positioned below the MA-20 but above the MA-50 on the H1 chart, with the MA-200 well overhead. The Ichimoku Kijun at $44.03 is acting as near-term resistance, defining a key pivot point. Support can be seen at $42.65, while resistance aligns with $45.11. On the indicator side, MACD signals strong buy momentum, but the ADX is neutral, and both RSI and CCI are in neutral zones. Stoch RSI is oversold, suggesting selling pressure may be waning, while Bull/Bear Power shows slight intraday buyer advantage.
Range stability favored amid breakout and breakdown risks
Over the next several sessions, BROS is likely to trade within a typical volatility band between $42.65 and $45.11. The baseline view is for prices to stabilize in this range. A move above $44.03 resistance could spark a bullish breakout, while a decisive drop below $42.65 support would open the door for further downside. Probabilities tilt slightly in favor of an upward move, but both scenarios remain plausible given current technical signals.
Earlier, analysts noted that Dutch Bros was demonstrating short- to medium-term bullish momentum but remained constrained by longer-term resistance. The latest results add a new dimension with robust sales growth and expanding store count, but continued insider selling and a mixed full-year outlook highlight $44.03 as a pivotal technical level for potential breakout or further consolidation.










-
 Afghanistan
-
 Albania
-
 Algeria
-
 Angola
-
 Argentina
-
 Armenia
-
 Australia
-
 Austria
-
 Azerbaijan
-
 Bahamas
-
 Bahrain
-
 Bangladesh
-
 Belarus
-
 Belgium
-
 Bolivia
-
 Botswana
-
 Brazil
-
 Brunei
-
 Bulgaria
-
 Cambodia
-
 Cameroon
-
 Canada
-
 Chile
-
 China
-
 Colombia
-
 Congo
-
 Costa Rica
-
 Cote d'Ivoire
-
 Croatia
-
 Cuba
-
 Cyprus
-
 Czechia
-
 DR Congo
-
 Denmark
-
 Dominican Republic
-
 Ecuador
-
 Egypt
-
 El Salvador
-
 Estonia
-
 Eswatini
-
 Ethiopia
-
 Finland
-
 France
-
 Georgia
-
 Germany
-
 Ghana
-
 Greece
-
 Haiti
-
 Hong Kong
-
 Hungary
-
 India
-
 Indonesia
-
 Iran, Islamic republic
-
 Iraq
-
 Ireland
-
 Israel
-
 Italy
-
 Jamaica
-
 Japan
-
 Jordan
-
 Kazakhstan
-
 Kenya
-
 Korea
-
 Kuwait
-
 Kyrgyzstan
-
 Laos
-
 Latvia
-
 Lebanon
-
 Lesotho
-
 Libya
-
 Lithuania
-
 Luxembourg
-
 Madagascar
-
 Malaysia
-
 Malta
-
 Mauritius
-
 Mexico
-
 Moldova
-
 Mongolia
-
 Montenegro
-
 Morocco
-
 Mozambique
-
 Myanmar
-
 Namibia
-
 Nepal
-
 Netherlands
-
 New Zealand
-
 Nigeria
-
 North Macedonia
-
 Norway
-
 Oman
-
 Pakistan
-
 Palestine
-
 Panama
-
 Papua New Guinea
-
 Paraguay
-
 Peru
-
 Philippines
-
 Poland
-
 Portugal
-
 Puerto Rico
-
 Qatar
-
 Reunion
-
 Romania
-
 Rwanda
-
 Saudi Arabia
-
 Serbia
-
 Singapore
-
 Slovakia
-
 Slovenia
-
 Somalia
-
 South Africa
-
 Spain
-
 Sri Lanka
-
 Sweden
-
 Switzerland
-
 Syria
-
 Taiwan
-
 Tajikistan
-
 Tanzania
-
 Thailand
-
 Trinidad and Tobago
-
 Tunisia
-
 Turkey
-
 UAE
-
 Uganda
-
 Ukraine
-
 United Kingdom
-
United States
-
 Uruguay
-
 Uzbekistan
-
 Venezuela
-
 Vietnam
-
 Yemen
-
 Zambia
-
 Zimbabwe
- Forex
- Crypto












