

Meta Platforms shares technical analysis: Approaches $645.71 resistance with bullish momentum signals

Meta Platforms (META) stock is trading at $630.13, up 1.47% on the day and showing moderate volatility. The price currently sits above its key short- and medium-term moving averages, while remaining below longer-term thresholds.
 625.60
641.30
Highlights
- Meta Platforms announced a $15 billion bond issuance in five tranches to fund artificial intelligence projects and increase liquidity.
- The company reported negative free cash flow for the first time since 2012 after raising third-quarter capital expenditures to $34.9 billion.
- Meta Platforms stock trades with short- and medium-term bullish structure, expected to fluctuate between $614.55 and $645.71 with a 55% probability of an upward move.
Investor optimism rises as bond sale funds AI but profitability concerns grow
Meta Platforms' announcement on November 3, 2026, to raise $15 billion by issuing five tranches of U.S. dollar-denominated bonds to fund artificial intelligence initiatives, according to Gurufocus, is actively supporting optimism around the stock. This significant capital infusion will boost liquidity and highlights the company's commitment to long-term technological advancement, attracting investor interest. However, the disclosure of negative free cash flow for the first time since 2012, following a rise in third-quarter capital expenditures to $34.9 billion, introduces some caution about near-term profitability.
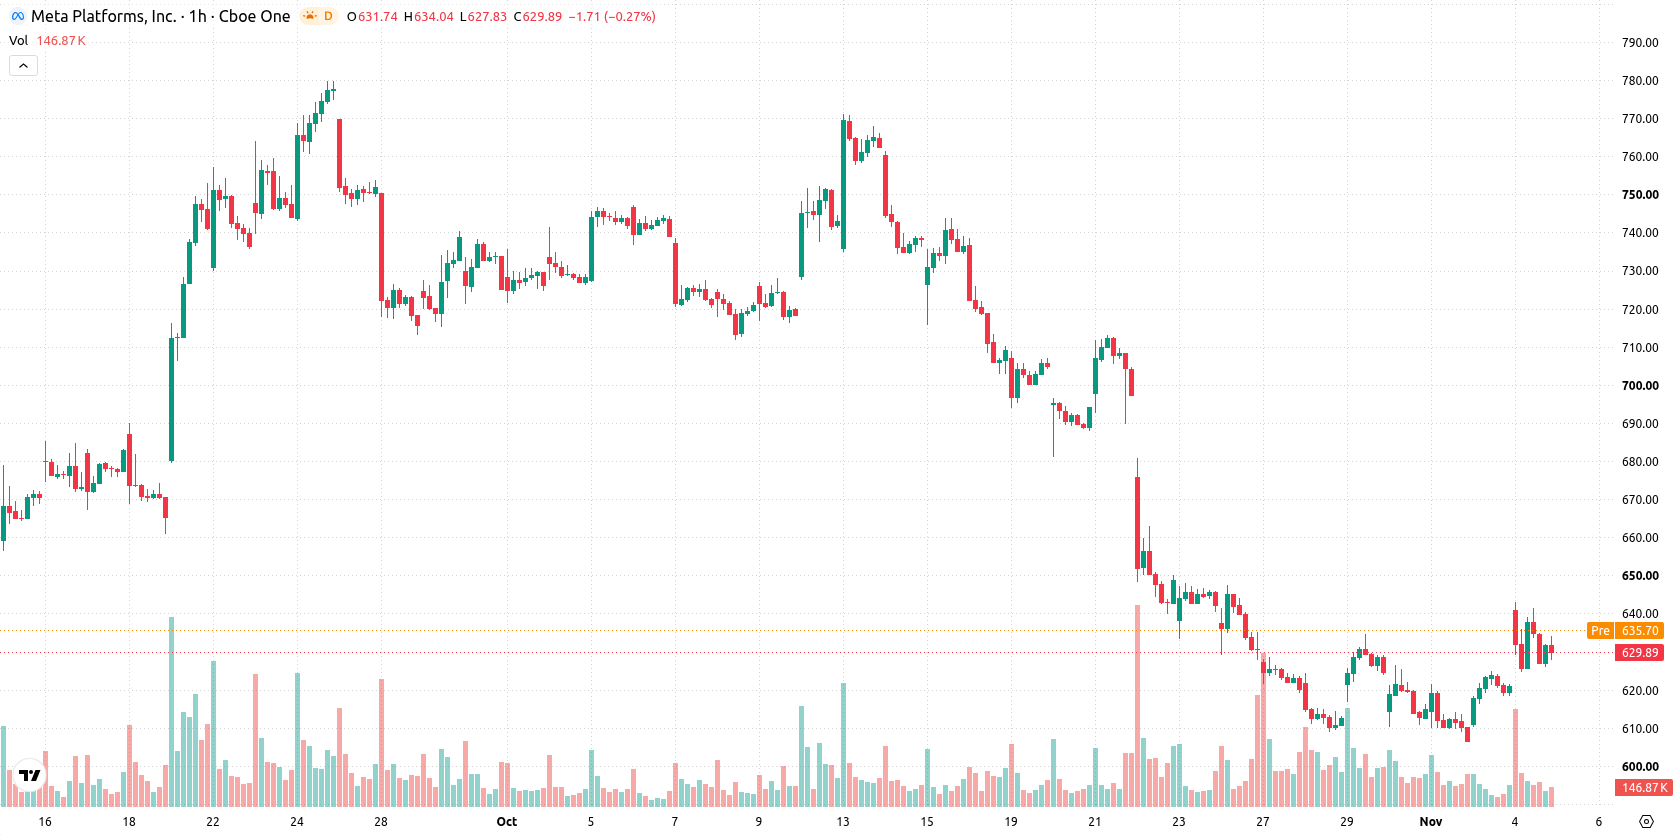
Short-term momentum contrasts with longer-term resistance in technical setup
On the technical front, META is positioned above both its MA-20 and MA-50 on the hourly chart but remains below the MA-200 on the daily timeframe, reflecting a divergence between short-/medium-term momentum and longer-term resistance. The Ichimoku Kijun level at $624.75 serves as a key support. MACD and ADX are both signaling Buy conditions, while RSI, Stochastic RSI, and CCI are neutral, indicating neither overbought nor oversold extremes. Bull/Bear Power is moderately positive at 7.17, reflecting buyer influence in today's session, while the Awesome Oscillator remains neutral.
Breakout probabilities weighed as price consolidates within volatility band
Over the coming sessions, META is expected to trade within a volatility band from $614.55 to $645.71. The baseline scenario foresees continued consolidation inside this corridor, with a 55% probability of an upward breakout compared to a 45% chance of decline. A move above upper resistance may trigger further gains, while a drop below the $614.55 support would increase short-term bearish risks.
Previously it was reported that Meta deepened its investment in AI software tools with the acquisition of Conductor, signaling a broader push into developer-centric artificial intelligence solutions. The current technical setup suggests that a decisive break above the $645.71 resistance could confirm Meta’s longer-term uptrend, while a sustained drop below $614.55 would introduce downside risk in the sessions ahead.










-
 Afghanistan
-
 Albania
-
 Algeria
-
 Angola
-
 Argentina
-
 Armenia
-
 Australia
-
 Austria
-
 Azerbaijan
-
 Bahamas
-
 Bahrain
-
 Bangladesh
-
 Belarus
-
 Belgium
-
 Bolivia
-
 Botswana
-
 Brazil
-
 Brunei
-
 Bulgaria
-
 Cambodia
-
 Cameroon
-
 Canada
-
 Chile
-
 China
-
 Colombia
-
 Congo
-
 Costa Rica
-
 Cote d'Ivoire
-
 Croatia
-
 Cuba
-
 Cyprus
-
 Czechia
-
 DR Congo
-
 Denmark
-
 Dominican Republic
-
 Ecuador
-
 Egypt
-
 El Salvador
-
 Estonia
-
 Eswatini
-
 Ethiopia
-
 Finland
-
 France
-
 Georgia
-
 Germany
-
 Ghana
-
 Greece
-
 Haiti
-
 Hong Kong
-
 Hungary
-
 India
-
 Indonesia
-
 Iran, Islamic republic
-
 Iraq
-
 Ireland
-
 Israel
-
 Italy
-
 Jamaica
-
 Japan
-
 Jordan
-
 Kazakhstan
-
 Kenya
-
 Korea
-
 Kuwait
-
 Kyrgyzstan
-
 Laos
-
 Latvia
-
 Lebanon
-
 Lesotho
-
 Libya
-
 Lithuania
-
 Luxembourg
-
 Madagascar
-
 Malaysia
-
 Malta
-
 Mauritius
-
 Mexico
-
 Moldova
-
 Mongolia
-
 Montenegro
-
 Morocco
-
 Mozambique
-
 Myanmar
-
 Namibia
-
 Nepal
-
 Netherlands
-
 New Zealand
-
 Nigeria
-
 North Macedonia
-
 Norway
-
 Oman
-
 Pakistan
-
 Palestine
-
 Panama
-
 Papua New Guinea
-
 Paraguay
-
 Peru
-
 Philippines
-
 Poland
-
 Portugal
-
 Puerto Rico
-
 Qatar
-
 Reunion
-
 Romania
-
 Rwanda
-
 Saudi Arabia
-
 Serbia
-
 Singapore
-
 Slovakia
-
 Slovenia
-
 Somalia
-
 South Africa
-
 Spain
-
 Sri Lanka
-
 Sweden
-
 Switzerland
-
 Syria
-
 Taiwan
-
 Tajikistan
-
 Tanzania
-
 Thailand
-
 Trinidad and Tobago
-
 Tunisia
-
 Turkey
-
 UAE
-
 Uganda
-
 Ukraine
-
 United Kingdom
-
United States
-
 Uruguay
-
 Uzbekistan
-
 Venezuela
-
 Vietnam
-
 Yemen
-
 Zambia
-
 Zimbabwe
- Forex
- Crypto












