

Mastercard stock weekly forecast: Recovery holds but faces a stretched setup

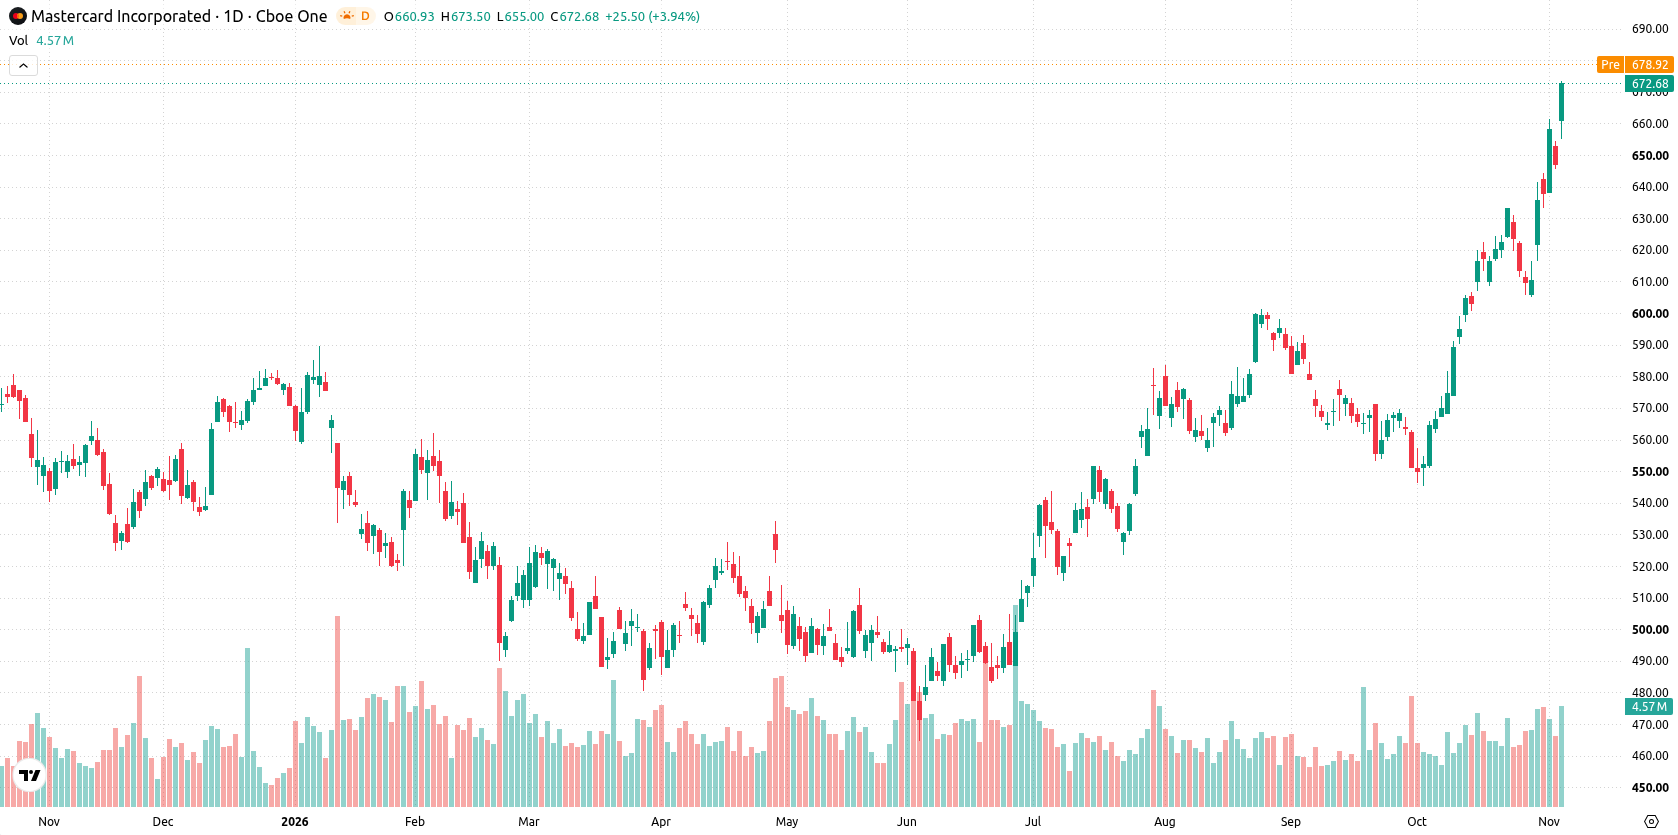
Shares of Mastercard Inc (MA) are trading near $672, registering an advance of more than 5% over the past week as the recovery holds firm. A robust earnings beat and ongoing share buybacks propelled this momentum, while stretched technicals may test the rally’s durability in the days ahead.
 659.59
676.57
Highlights
- Shares of Mastercard gained 5.41% over the past seven days to $672.49, trading in a bullish structure.
- Technical indicators show strong upward momentum but overbought conditions, suggesting the risk of a short-term pullback.
- Expected range for the coming week is $654.93 to $709.39, with an over 80% probability of upside continuation.
Revenue surge and product launches lift sentiment as buybacks accelerate
Mastercard reported a strong third-quarter result with net revenue up 14% to $9.81 billion and non-GAAP earnings per share of $5.31, surpassing analysts’ expectations, according to Yahoo Finance. Growth was driven by expansion in its payment network, cross-border volume gains, and the launch of new products. The company also accelerated its shareholder returns with $3 billion in share repurchases and signaled further buybacks, while investing in agentic commerce and stablecoin settlements following the acquisition of BVNK.
Overbought signals emerge as technicals support ongoing bullish momentum
The daily chart shows a strong trend, with the price pinned to the weekly resistance at $673.1 and volatility at 6.19%. RSI and CCI are both in overbought territory, with readings of 74.86 and 195.17 respectively, highlighting potential overheating and a risk of short-term correction. Momentum remains firmly upward, supported by a bullish MACD and the HMA signaling a strong buy, while support is found at $633.84 and backup from the Ichimoku Kijun at $609.65. This setup suggests a sustained move higher with a firm trend, but the overbought oscillator levels warrant caution for possible pullbacks.
Upside continuation likely next week as breakout risk stays elevated
Over the coming trading week, the expected range is $654.93 to $709.39. There is a very high probability (more than 80%) of an upside continuation and a very low probability (less than 20%) of a decline. The base case is for Mastercard stock to extend its advance or consolidate within this range. A bullish breakout above $673.1 would open the way toward the upper boundary at $709.39, while a correction below support at $633.84 could quickly shift momentum lower within the forecast range.
Previously it was reported that Mastercard's expanding partnerships and growing demand positioned the stock for continued short-term gains. The current outlook is reinforced by fresh earnings strength and technical momentum, with traders advised to monitor the $709.39 level as a potential upside breakout target in the coming week.






Latest Mastercard News





-
 Afghanistan
-
 Albania
-
 Algeria
-
 Angola
-
 Argentina
-
 Armenia
-
 Australia
-
 Austria
-
 Azerbaijan
-
 Bahamas
-
 Bahrain
-
 Bangladesh
-
 Belarus
-
 Belgium
-
 Bolivia
-
 Botswana
-
 Brazil
-
 Brunei
-
 Bulgaria
-
 Cambodia
-
 Cameroon
-
 Canada
-
 Chile
-
 China
-
 Colombia
-
 Congo
-
 Costa Rica
-
 Cote d'Ivoire
-
 Croatia
-
 Cuba
-
 Cyprus
-
 Czechia
-
 DR Congo
-
 Denmark
-
 Dominican Republic
-
 Ecuador
-
 Egypt
-
 El Salvador
-
 Estonia
-
 Eswatini
-
 Ethiopia
-
 Finland
-
 France
-
 Georgia
-
 Germany
-
 Ghana
-
 Greece
-
 Haiti
-
 Hong Kong
-
 Hungary
-
 India
-
 Indonesia
-
 Iran, Islamic republic
-
 Iraq
-
 Ireland
-
 Israel
-
 Italy
-
 Jamaica
-
 Japan
-
 Jordan
-
 Kazakhstan
-
 Kenya
-
 Korea
-
 Kuwait
-
 Kyrgyzstan
-
 Laos
-
 Latvia
-
 Lebanon
-
 Lesotho
-
 Libya
-
 Lithuania
-
 Luxembourg
-
 Madagascar
-
 Malaysia
-
 Malta
-
 Mauritius
-
 Mexico
-
 Moldova
-
 Mongolia
-
 Montenegro
-
 Morocco
-
 Mozambique
-
 Myanmar
-
 Namibia
-
 Nepal
-
 Netherlands
-
 New Zealand
-
 Nigeria
-
 North Macedonia
-
 Norway
-
 Oman
-
 Pakistan
-
 Palestine
-
 Panama
-
 Papua New Guinea
-
 Paraguay
-
 Peru
-
 Philippines
-
 Poland
-
 Portugal
-
 Puerto Rico
-
 Qatar
-
 Reunion
-
 Romania
-
 Rwanda
-
 Saudi Arabia
-
 Serbia
-
 Singapore
-
 Slovakia
-
 Slovenia
-
 Somalia
-
 South Africa
-
 Spain
-
 Sri Lanka
-
 Sweden
-
 Switzerland
-
 Syria
-
 Taiwan
-
 Tajikistan
-
 Tanzania
-
 Thailand
-
 Trinidad and Tobago
-
 Tunisia
-
 Turkey
-
 UAE
-
 Uganda
-
 Ukraine
-
 United Kingdom
-
United States
-
 Uruguay
-
 Uzbekistan
-
 Venezuela
-
 Vietnam
-
 Yemen
-
 Zambia
-
 Zimbabwe
- Forex
- Crypto












