

Amazon shares weekly forecast: Overbought signals raise correction risk as volatility stays elevated

Shares of Amazon.com, Inc. (AMZN) are trading near $266 after climbing more than 10% over the past week, supported by robust earnings and a resilient recovery. Corporate results drove strong upside as the company’s core business outperformed, but investors are now watching for signs of stress from cash outflows as the stretched technical setup enters the coming week.
 273.23
Highlights
- Shares of Amazon rose 10.55% over the past week to $265.92, trading above key moving averages.
- Momentum indicators are mixed, as CCI and Stoch RSI are overbought, with MACD showing a strong sell.
- For the coming week, Amazon shares are expected to trade between $249.91 and $281.92, with key support at $254.23 and resistance at $271.46.
Record AWS gains and AI spending drive mixed post-earnings sentiment
Amazon reported its third quarter financial results, with net sales rising 12% year-over-year to $201.9 billion and operating income reaching a record $28.1 billion, according to Business Wire. Amazon Web Services growth accelerated, with segment revenue up 39% to $46 billion as detailed by StockTitan. Despite the strong performance, free cash flow saw a record outflow of more than $42 billion over the past year due to heavy investment in AI and infrastructure, as noted by Yahoo Finance. Shares were volatile after the report but later rebounded as analysts highlighted AWS growth and backlog, according to MarketBeat.
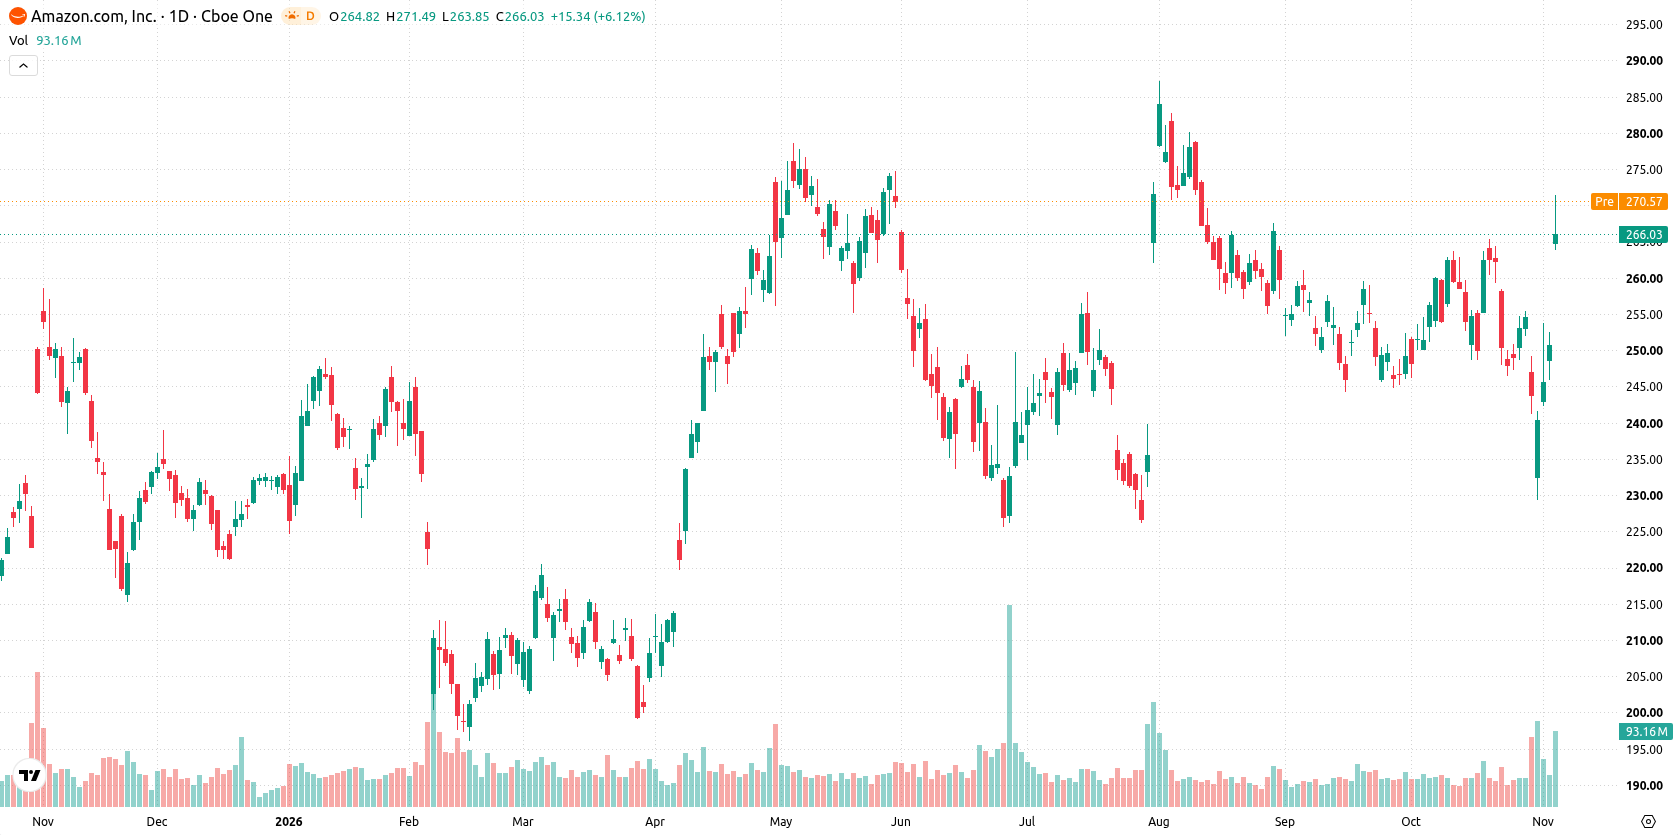
Correction risk builds as mixed signals and overbought CCI emerge this week
The daily chart shows a sharp move higher without a sustained trend, with momentum signals presenting mixed cues. While CCI and Stoch RSI are both confirmed overbought, highlighting potential correction risk, the RSI at 60.78 remains in a neutral zone and MACD tilts to a strong sell. Volatility over the past week has been high at 15.18%. The nearest support sits at $254.23, while resistance is near the recent high at $271.46.
Consolidation favored next week as breakout levels define directional risk
For the coming trading week, the expected range is $249.91 to $281.92. The probability of an increase is 71%, while the probability of a decrease is 29%. The base case favors consolidation within support at $254.23 and resistance at $271.46. A break above $271.46 could signal further upside toward the range top. A drop below $254.23 would open the risk of a correction into the mid-$250s.
Earlier, analysts noted that Amazon’s strength was reinforced by market dynamics favoring established technology leaders even as regulatory and competitive pressures mounted in the AI infrastructure space. The current outlook adds a new dimension, with elevated cash outflows and a technically overbought setup making the $254.23 support and $271.46 resistance critical levels to monitor in the near term.






Latest Amazon News





-
 Afghanistan
-
 Albania
-
 Algeria
-
 Angola
-
 Argentina
-
 Armenia
-
 Australia
-
 Austria
-
 Azerbaijan
-
 Bahamas
-
 Bahrain
-
 Bangladesh
-
 Belarus
-
 Belgium
-
 Bolivia
-
 Botswana
-
 Brazil
-
 Brunei
-
 Bulgaria
-
 Cambodia
-
 Cameroon
-
 Canada
-
 Chile
-
 China
-
 Colombia
-
 Congo
-
 Costa Rica
-
 Cote d'Ivoire
-
 Croatia
-
 Cuba
-
 Cyprus
-
 Czechia
-
 DR Congo
-
 Denmark
-
 Dominican Republic
-
 Ecuador
-
 Egypt
-
 El Salvador
-
 Estonia
-
 Eswatini
-
 Ethiopia
-
 Finland
-
 France
-
 Georgia
-
 Germany
-
 Ghana
-
 Greece
-
 Haiti
-
 Hong Kong
-
 Hungary
-
 India
-
 Indonesia
-
 Iran, Islamic republic
-
 Iraq
-
 Ireland
-
 Israel
-
 Italy
-
 Jamaica
-
 Japan
-
 Jordan
-
 Kazakhstan
-
 Kenya
-
 Korea
-
 Kuwait
-
 Kyrgyzstan
-
 Laos
-
 Latvia
-
 Lebanon
-
 Lesotho
-
 Libya
-
 Lithuania
-
 Luxembourg
-
 Madagascar
-
 Malaysia
-
 Malta
-
 Mauritius
-
 Mexico
-
 Moldova
-
 Mongolia
-
 Montenegro
-
 Morocco
-
 Mozambique
-
 Myanmar
-
 Namibia
-
 Nepal
-
 Netherlands
-
 New Zealand
-
 Nigeria
-
 North Macedonia
-
 Norway
-
 Oman
-
 Pakistan
-
 Palestine
-
 Panama
-
 Papua New Guinea
-
 Paraguay
-
 Peru
-
 Philippines
-
 Poland
-
 Portugal
-
 Puerto Rico
-
 Qatar
-
 Reunion
-
 Romania
-
 Rwanda
-
 Saudi Arabia
-
 Serbia
-
 Singapore
-
 Slovakia
-
 Slovenia
-
 Somalia
-
 South Africa
-
 Spain
-
 Sri Lanka
-
 Sweden
-
 Switzerland
-
 Syria
-
 Taiwan
-
 Tajikistan
-
 Tanzania
-
 Thailand
-
 Trinidad and Tobago
-
 Tunisia
-
 Turkey
-
 UAE
-
 Uganda
-
 Ukraine
-
 United Kingdom
-
United States
-
 Uruguay
-
 Uzbekistan
-
 Venezuela
-
 Vietnam
-
 Yemen
-
 Zambia
-
 Zimbabwe
- Forex
- Crypto












