

Berkshire Hathaway shares weekly forecast: RSI signals possible overheating risk

Shares of Berkshire Hathaway Inc. (BRK.B) are trading near $580 after climbing nearly 7% over the past week, as positive corporate momentum continues to push the rally forward. Investors will be watching closely as high levels and stretched technicals set the backdrop for the coming days.
 591.98
596.23
Highlights
- Shares of Berkshire Hathaway rose 6.81% over the past 7 days to $579.68, trading above key moving averages.
- Technical indicators show a strong bullish setup, but overbought conditions increase the risk of a short-term correction.
- The expected price range for the coming week is $562.34 to $597.01, with key support at $541.83 and resistance at $580.6.
Earnings anticipation and buybacks drive optimism amid major capital moves
Berkshire is preparing to release its third quarter earnings and Form 10-Q on Saturday, November 7, 2026, an event that promises heightened investor focus according to StockTitan. The company recently executed sizable share buybacks, with at least $10.1 billion repurchased in July, and completed a $330 million investment in Italian technology group Bending Spoons as reported by Yahoo Finance and FXLeaders. Berkshire will also receive higher annual dividends from Coca-Cola after the beverage giant's 64th consecutive dividend raise, according to Yahoo Finance.
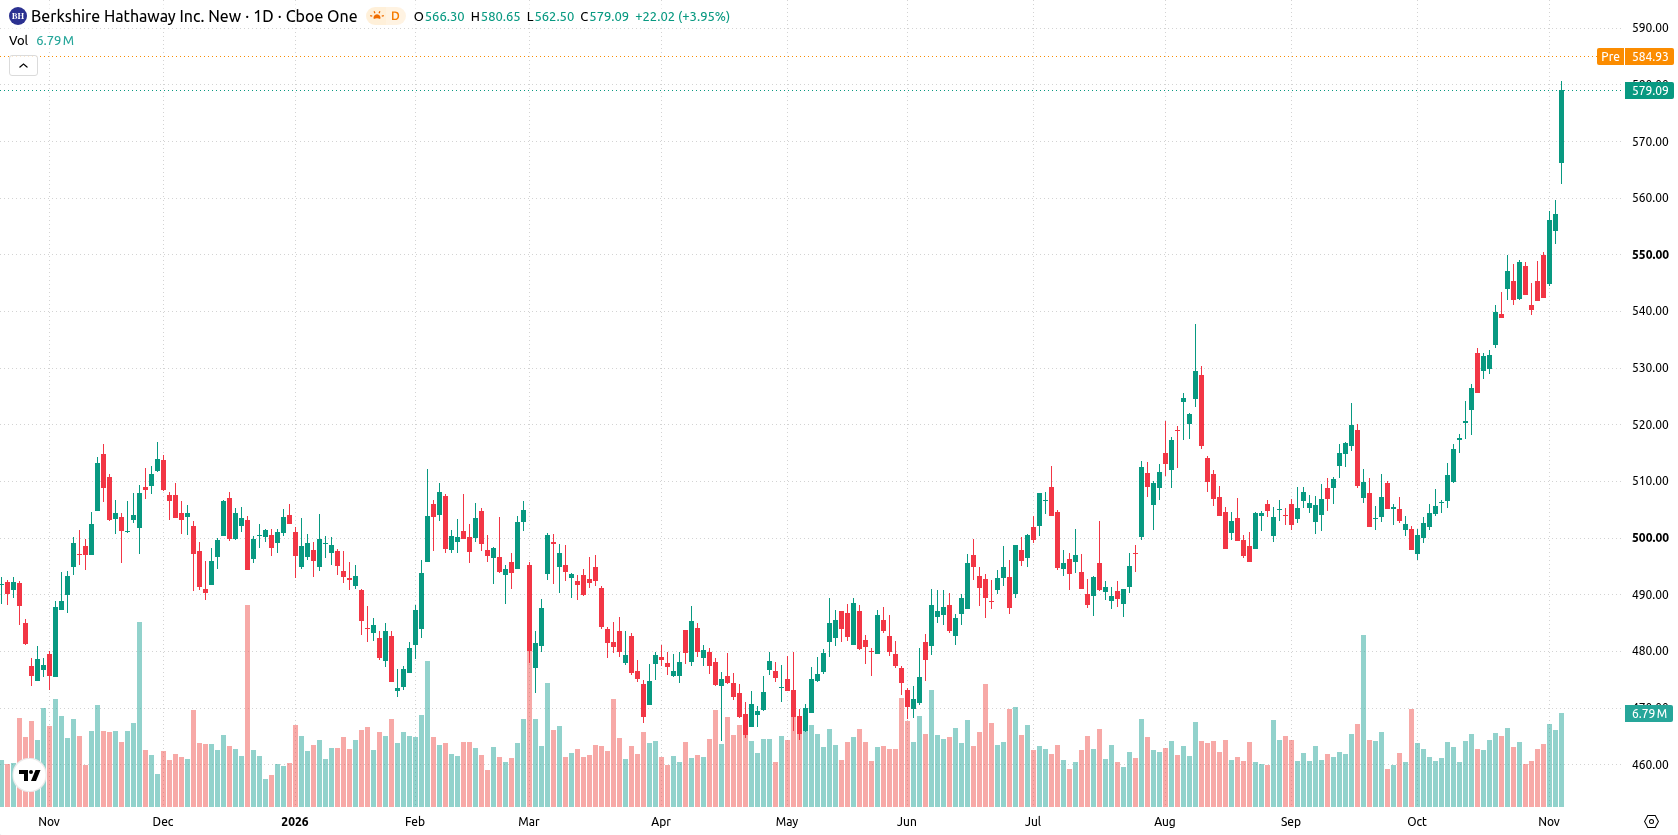
Momentum persists this week as technicals flash overbought correction risk
On the daily chart, the trend remains firmly intact, reinforced by a sustained move higher with a firm trend and backed by robust momentum. Both the RSI at 83.26 and CCI at 199.79 are in overbought territory, highlighting possible overheating and downside correction risk even as MACD continues to point higher. Volatility over the past week is elevated at 7.16%. The stock is currently sitting at the $580.6 resistance, with nearest support at $541.83 and the Ichimoku Kijun at $537.14 providing additional backup.
Breakout likely next week as consolidation holds unless support fails
Over the coming trading week, the expected range is $562.34 to $597.01. There is a very high probability (more than 80%) of further gains, with a very low probability (less than 20%) of a decline. Base case, the stock consolidates or edges higher inside the range. A move above $580.6 would signal renewed breakout momentum, while a decline below $541.83 would point to corrective downside risk.
Earlier, analysts noted that Berkshire Hathaway shares exhibited strong bullish momentum while approaching key resistance, with short-term consolidation likely before a potential breakout. With the current rally extending into overbought technical territory and earnings on the horizon, traders should watch for volatility around the $580.6 resistance, as a decisive move above this level could trigger a renewed upward leg.






Latest Berkshire Hathaway News





-
 Afghanistan
-
 Albania
-
 Algeria
-
 Angola
-
 Argentina
-
 Armenia
-
 Australia
-
 Austria
-
 Azerbaijan
-
 Bahamas
-
 Bahrain
-
 Bangladesh
-
 Belarus
-
 Belgium
-
 Bolivia
-
 Botswana
-
 Brazil
-
 Brunei
-
 Bulgaria
-
 Cambodia
-
 Cameroon
-
 Canada
-
 Chile
-
 China
-
 Colombia
-
 Congo
-
 Costa Rica
-
 Cote d'Ivoire
-
 Croatia
-
 Cuba
-
 Cyprus
-
 Czechia
-
 DR Congo
-
 Denmark
-
 Dominican Republic
-
 Ecuador
-
 Egypt
-
 El Salvador
-
 Estonia
-
 Eswatini
-
 Ethiopia
-
 Finland
-
 France
-
 Georgia
-
 Germany
-
 Ghana
-
 Greece
-
 Haiti
-
 Hong Kong
-
 Hungary
-
 India
-
 Indonesia
-
 Iran, Islamic republic
-
 Iraq
-
 Ireland
-
 Israel
-
 Italy
-
 Jamaica
-
 Japan
-
 Jordan
-
 Kazakhstan
-
 Kenya
-
 Korea
-
 Kuwait
-
 Kyrgyzstan
-
 Laos
-
 Latvia
-
 Lebanon
-
 Lesotho
-
 Libya
-
 Lithuania
-
 Luxembourg
-
 Madagascar
-
 Malaysia
-
 Malta
-
 Mauritius
-
 Mexico
-
 Moldova
-
 Mongolia
-
 Montenegro
-
 Morocco
-
 Mozambique
-
 Myanmar
-
 Namibia
-
 Nepal
-
 Netherlands
-
 New Zealand
-
 Nigeria
-
 North Macedonia
-
 Norway
-
 Oman
-
 Pakistan
-
 Palestine
-
 Panama
-
 Papua New Guinea
-
 Paraguay
-
 Peru
-
 Philippines
-
 Poland
-
 Portugal
-
 Puerto Rico
-
 Qatar
-
 Reunion
-
 Romania
-
 Rwanda
-
 Saudi Arabia
-
 Serbia
-
 Singapore
-
 Slovakia
-
 Slovenia
-
 Somalia
-
 South Africa
-
 Spain
-
 Sri Lanka
-
 Sweden
-
 Switzerland
-
 Syria
-
 Taiwan
-
 Tajikistan
-
 Tanzania
-
 Thailand
-
 Trinidad and Tobago
-
 Tunisia
-
 Turkey
-
 UAE
-
 Uganda
-
 Ukraine
-
 United Kingdom
-
United States
-
 Uruguay
-
 Uzbekistan
-
 Venezuela
-
 Vietnam
-
 Yemen
-
 Zambia
-
 Zimbabwe
- Forex
- Crypto












