

Okta shares drop more than 8% after S&P 500 addition triggers ETF outflows

Okta Inc (OKTA) declined 8.09% after being added to the S&P 500 index, as index-related fund flows led to heavy selling in the session. The move is supported by negative momentum and the stock remaining below key short- and medium-term moving averages.
 185.59
188.17
Highlights
- Okta stock was added to the S&P 500, with index-tracking ETFs posting net outflows of $360.6 million on November 3.
- Institutional trades were mixed, as Mirae Asset Global Investments increased its Okta holdings and Sumitomo Mitsui Trust Group reduced its position.
- Okta stock trades below short- and medium-term averages, with technical indicators showing selling pressure and expected to range from $156.17 to $195.03 in the next 5 days.
ETF outflows and mixed institutional moves intensify stock pressure
Okta was added to the S&P 500 index, moving from the S&P 400 mid-cap index. The adjustment prompted funds and ETFs that track these indices to rebalance, with ETFs reported as net sellers of Okta stock with a net outflow of $360.6 million on November 3. Institutional activity included Mirae Asset Global Investments acquiring 62,969 shares during the third quarter, while Sumitomo Mitsui Trust Group reduced its stake by 16,270 shares. Okta also published a survey finding that 80% of organizations see slower-than-anticipated progress on AI features due to governance and infrastructure challenges, though price action has remained under broader selling pressure.
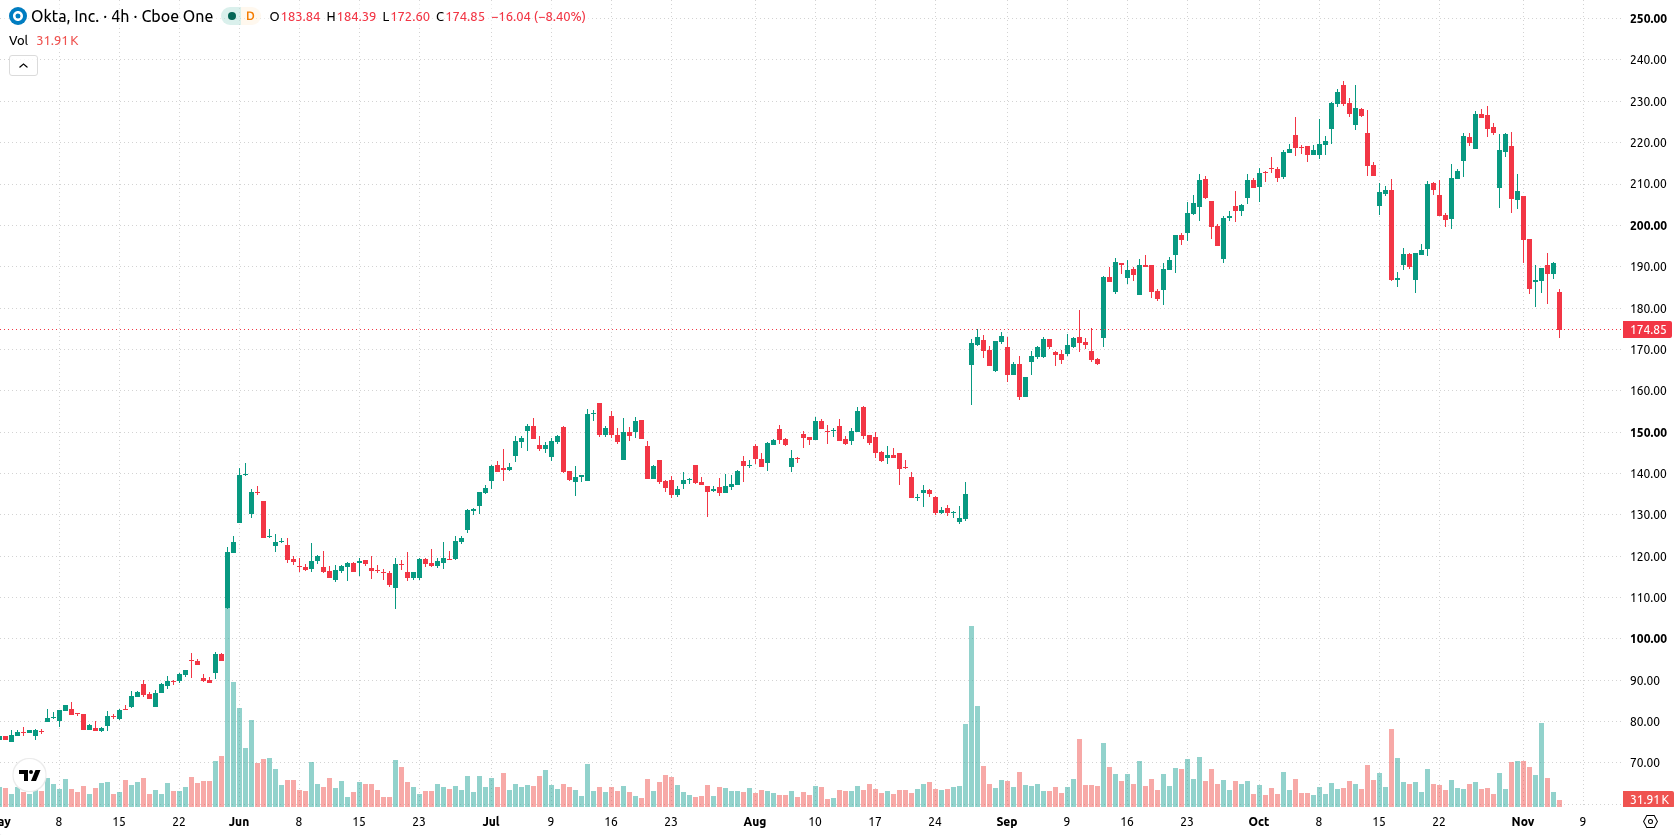
Persistent short-term weakness as sellers persist despite oversold signs
Okta trades below its 20-day ($209.21) and 50-day ($196.13) moving averages, indicating persistent short- and medium-term weakness, but remains above the 200-day ($125.98) average, keeping a bullish longer-term structure. Key levels are identified with resistance at $182.15 and support at $156.17. Momentum indicators are broadly negative, with the Moving Average Convergence Divergence (MACD) staying neutral and the Average Directional Index (ADX) confirming selling pressure. The Relative Strength Index (RSI) is neutral, while both the Stochastic RSI and Commodity Channel Index (CCI) register in their oversold zones, signalling possible selling exhaustion. Bull/Bear Power (BBP) remains negative, supporting the dominance of sellers within intraday price action. The stock continues to encounter pressure after the open, consistent with these technical signals.
Earlier, analysts highlighted Okta's strong bullish momentum amid increased institutional demand driven by cybersecurity concerns. The current reversal following its S&P 500 inclusion marks a shift to short- and medium-term technical weakness, making $156.17 and $195.03 the critical levels to monitor for potential breakout or breakdown over the coming sessions.










-
 Afghanistan
-
 Albania
-
 Algeria
-
 Angola
-
 Argentina
-
 Armenia
-
 Australia
-
 Austria
-
 Azerbaijan
-
 Bahamas
-
 Bahrain
-
 Bangladesh
-
 Belarus
-
 Belgium
-
 Bolivia
-
 Botswana
-
 Brazil
-
 Brunei
-
 Bulgaria
-
 Cambodia
-
 Cameroon
-
 Canada
-
 Chile
-
 China
-
 Colombia
-
 Congo
-
 Costa Rica
-
 Cote d'Ivoire
-
 Croatia
-
 Cuba
-
 Cyprus
-
 Czechia
-
 DR Congo
-
 Denmark
-
 Dominican Republic
-
 Ecuador
-
 Egypt
-
 El Salvador
-
 Estonia
-
 Eswatini
-
 Ethiopia
-
 Finland
-
 France
-
 Georgia
-
 Germany
-
 Ghana
-
 Greece
-
 Haiti
-
 Hong Kong
-
 Hungary
-
 India
-
 Indonesia
-
 Iran, Islamic republic
-
 Iraq
-
 Ireland
-
 Israel
-
 Italy
-
 Jamaica
-
 Japan
-
 Jordan
-
 Kazakhstan
-
 Kenya
-
 Korea
-
 Kuwait
-
 Kyrgyzstan
-
 Laos
-
 Latvia
-
 Lebanon
-
 Lesotho
-
 Libya
-
 Lithuania
-
 Luxembourg
-
 Madagascar
-
 Malaysia
-
 Malta
-
 Mauritius
-
 Mexico
-
 Moldova
-
 Mongolia
-
 Montenegro
-
 Morocco
-
 Mozambique
-
 Myanmar
-
 Namibia
-
 Nepal
-
 Netherlands
-
 New Zealand
-
 Nigeria
-
 North Macedonia
-
 Norway
-
 Oman
-
 Pakistan
-
 Palestine
-
 Panama
-
 Papua New Guinea
-
 Paraguay
-
 Peru
-
 Philippines
-
 Poland
-
 Portugal
-
 Puerto Rico
-
 Qatar
-
 Reunion
-
 Romania
-
 Rwanda
-
 Saudi Arabia
-
 Serbia
-
 Singapore
-
 Slovakia
-
 Slovenia
-
 Somalia
-
 South Africa
-
 Spain
-
 Sri Lanka
-
 Sweden
-
 Switzerland
-
 Syria
-
 Taiwan
-
 Tajikistan
-
 Tanzania
-
 Thailand
-
 Trinidad and Tobago
-
 Tunisia
-
 Turkey
-
 UAE
-
 Uganda
-
 Ukraine
-
 United Kingdom
-
United States
-
 Uruguay
-
 Uzbekistan
-
 Venezuela
-
 Vietnam
-
 Yemen
-
 Zambia
-
 Zimbabwe
- Forex
- Crypto












