

Steel Dynamics shares drop about 5.5% after heavy intraday volatility and downtrend pressure

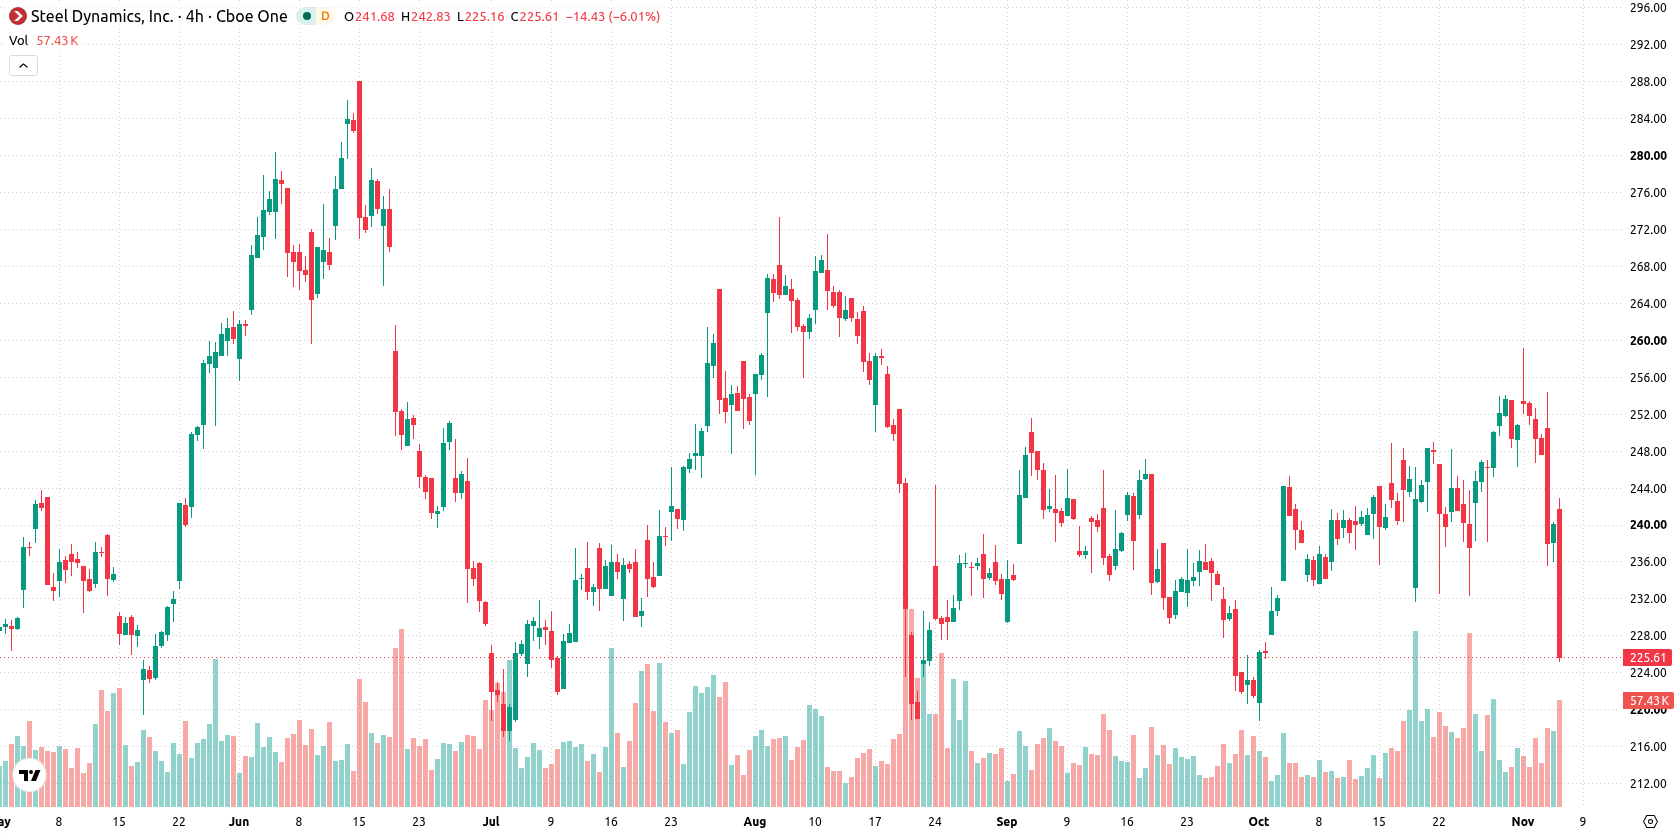
Steel Dynamics Inc (STLD) fell 5.58% today as sellers dominated intraday trading, driven by heavy downward pressure and high volatility. The decline is partially limited by the stock holding just above its 200-day moving average, which provides some long-term technical support.
 229.75
258.93
Highlights
- Shares of Steel Dynamics trade below short- and medium-term moving averages but remain above long-term support levels.
- Momentum indicators paint a mixed picture, with some buy signals offset by neutral and oversold readings.
- Steel Dynamics stock is expected to trade between $214.76 and $238.69 over the next five sessions, with risk skewed 60% to the downside.
Mixed momentum amid support at 200-day and near resistance
Steel Dynamics is trading below both its 20-day ($243.65) and 50-day ($238.91) moving averages, reflecting short- and medium-term selling pressure. However, it remains just above the 200-day moving average at $224.96, which offers a level of longer-term support. Immediate resistance stands at $230.94, and the near-term floor is set at $224.96, with the broader trend still confirmed as bullish given the 50-day versus 200-day alignment. Momentum signals are mixed: the MACD flashes a strong buy, the ADX is neutral with no clear trend, and the RSI, CCI, and intraday Bull/Bear Power are all neutral. The Stochastic RSI is in the oversold zone, and the Awesome Oscillator is positive, indicating underlying buyer interest. Intraday activity opened with an upside gap, but the tone quickly shifted to heavy pressure, resulting in the session low amid 5.33% volatility.
Earlier, analysts noted that Steel Dynamics was experiencing short-term selling pressure while longer-term technical indicators pointed to underlying strength. The most recent decline and surge in volatility reinforce the need to closely monitor the $224.96 support level, as a sustained break below this area could accelerate downside risk in the near term.






Latest Steel Dynamics Inc News


-
 Afghanistan
-
 Albania
-
 Algeria
-
 Angola
-
 Argentina
-
 Armenia
-
 Australia
-
 Austria
-
 Azerbaijan
-
 Bahamas
-
 Bahrain
-
 Bangladesh
-
 Belarus
-
 Belgium
-
 Bolivia
-
 Botswana
-
 Brazil
-
 Brunei
-
 Bulgaria
-
 Cambodia
-
 Cameroon
-
 Canada
-
 Chile
-
 China
-
 Colombia
-
 Congo
-
 Costa Rica
-
 Cote d'Ivoire
-
 Croatia
-
 Cuba
-
 Cyprus
-
 Czechia
-
 DR Congo
-
 Denmark
-
 Dominican Republic
-
 Ecuador
-
 Egypt
-
 El Salvador
-
 Estonia
-
 Eswatini
-
 Ethiopia
-
 Finland
-
 France
-
 Georgia
-
 Germany
-
 Ghana
-
 Greece
-
 Haiti
-
 Hong Kong
-
 Hungary
-
 India
-
 Indonesia
-
 Iran, Islamic republic
-
 Iraq
-
 Ireland
-
 Israel
-
 Italy
-
 Jamaica
-
 Japan
-
 Jordan
-
 Kazakhstan
-
 Kenya
-
 Korea
-
 Kuwait
-
 Kyrgyzstan
-
 Laos
-
 Latvia
-
 Lebanon
-
 Lesotho
-
 Libya
-
 Lithuania
-
 Luxembourg
-
 Madagascar
-
 Malaysia
-
 Malta
-
 Mauritius
-
 Mexico
-
 Moldova
-
 Mongolia
-
 Montenegro
-
 Morocco
-
 Mozambique
-
 Myanmar
-
 Namibia
-
 Nepal
-
 Netherlands
-
 New Zealand
-
 Nigeria
-
 North Macedonia
-
 Norway
-
 Oman
-
 Pakistan
-
 Palestine
-
 Panama
-
 Papua New Guinea
-
 Paraguay
-
 Peru
-
 Philippines
-
 Poland
-
 Portugal
-
 Puerto Rico
-
 Qatar
-
 Reunion
-
 Romania
-
 Rwanda
-
 Saudi Arabia
-
 Serbia
-
 Singapore
-
 Slovakia
-
 Slovenia
-
 Somalia
-
 South Africa
-
 Spain
-
 Sri Lanka
-
 Sweden
-
 Switzerland
-
 Syria
-
 Taiwan
-
 Tajikistan
-
 Tanzania
-
 Thailand
-
 Trinidad and Tobago
-
 Tunisia
-
 Turkey
-
 UAE
-
 Uganda
-
 Ukraine
-
 United Kingdom
-
United States
-
 Uruguay
-
 Uzbekistan
-
 Venezuela
-
 Vietnam
-
 Yemen
-
 Zambia
-
 Zimbabwe
- Forex
- Crypto












