

What's behind Brookfield's latest 3.6% stock pullback?

Brookfield Corporation (BN) fell 3.57% as strong technical selling momentum and overbought signals triggered a sharp pullback. The decline is supported by heavy tone after a downside gap and volatility, even as short- and medium-term moving averages remain bullish.
 59.18
61.30
Highlights
- Brookfield Corporation will release its third quarter 2026 earnings before the market opens on November 12.
- Shares of Brookfield stock trade above short- and medium-term averages but remain below the long-term average.
- Technical indicators show strong buying momentum with overbought signals and a forecast range of C$54.96 to C$61.1 for the next five days.
Investor focus shifts ahead of earnings release catalyst
Brookfield Corporation is scheduled to release its third quarter 2026 earnings before the market opens on November 12.
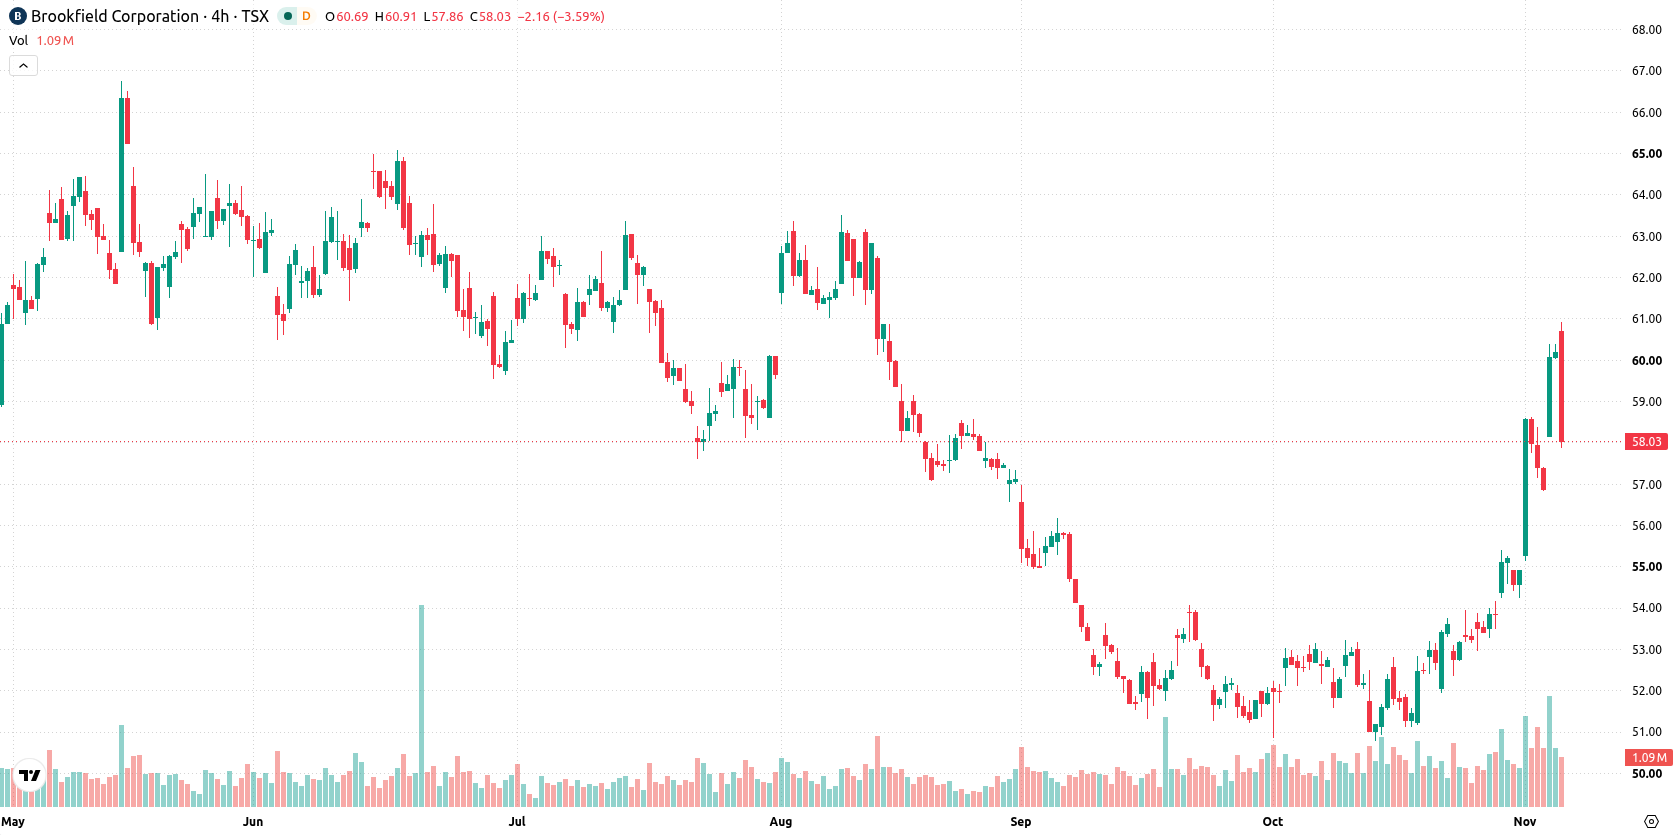
Momentum signals flash warning as price tests volatility support
Brookfield is trading above the 20-day and 50-day moving averages (C$53.71 and C$53.7), indicating short- and medium-term bullish momentum. The price remains below the 200-day moving average (C$59.04), reflecting a longer-term bearish alignment. Immediate technical focus is on C$58.14 as the near-term ceiling with support from the Ichimoku Kijun at C$55.58. Momentum is strong, with the MACD and Average Directional Index (ADX) both signaling a buy. The Relative Strength Index (RSI), Stochastic RSI, and Commodity Channel Index (CCI) are all in the overbought zone, indicating potential overheating and correction risk. Bull/Bear Power (BBP) and the Awesome Oscillator both confirm buyer control. After opening with a downside gap of about C$2.04 (3.39%), the stock has retreated to C$58.03, holding near the session low as intraday volatility reaches 3.85%. Tone is heavy as pressure persists and momentum signals suggest the advance may be overextended.
Earlier, analysts noted that Brookfield was exhibiting sustained bullish momentum, though overbought technical signals warranted caution for near-term corrections. The latest price action, highlighted by a sharp pullback amid increased volatility, adds fresh evidence of downside risk and underscores the importance of monitoring C$55.58 as a critical support level in the coming sessions.










-
 Afghanistan
-
 Albania
-
 Algeria
-
 Angola
-
 Argentina
-
 Armenia
-
 Australia
-
 Austria
-
 Azerbaijan
-
 Bahamas
-
 Bahrain
-
 Bangladesh
-
 Belarus
-
 Belgium
-
 Bolivia
-
 Botswana
-
 Brazil
-
 Brunei
-
 Bulgaria
-
 Cambodia
-
 Cameroon
-
 Canada
-
 Chile
-
 China
-
 Colombia
-
 Congo
-
 Costa Rica
-
 Cote d'Ivoire
-
 Croatia
-
 Cuba
-
 Cyprus
-
 Czechia
-
 DR Congo
-
 Denmark
-
 Dominican Republic
-
 Ecuador
-
 Egypt
-
 El Salvador
-
 Estonia
-
 Eswatini
-
 Ethiopia
-
 Finland
-
 France
-
 Georgia
-
 Germany
-
 Ghana
-
 Greece
-
 Haiti
-
 Hong Kong
-
 Hungary
-
 India
-
 Indonesia
-
 Iran, Islamic republic
-
 Iraq
-
 Ireland
-
 Israel
-
 Italy
-
 Jamaica
-
 Japan
-
 Jordan
-
 Kazakhstan
-
 Kenya
-
 Korea
-
 Kuwait
-
 Kyrgyzstan
-
 Laos
-
 Latvia
-
 Lebanon
-
 Lesotho
-
 Libya
-
 Lithuania
-
 Luxembourg
-
 Madagascar
-
 Malaysia
-
 Malta
-
 Mauritius
-
 Mexico
-
 Moldova
-
 Mongolia
-
 Montenegro
-
 Morocco
-
 Mozambique
-
 Myanmar
-
 Namibia
-
 Nepal
-
 Netherlands
-
 New Zealand
-
 Nigeria
-
 North Macedonia
-
 Norway
-
 Oman
-
 Pakistan
-
 Palestine
-
 Panama
-
 Papua New Guinea
-
 Paraguay
-
 Peru
-
 Philippines
-
 Poland
-
 Portugal
-
 Puerto Rico
-
 Qatar
-
 Reunion
-
 Romania
-
 Rwanda
-
 Saudi Arabia
-
 Serbia
-
 Singapore
-
 Slovakia
-
 Slovenia
-
 Somalia
-
 South Africa
-
 Spain
-
 Sri Lanka
-
 Sweden
-
 Switzerland
-
 Syria
-
 Taiwan
-
 Tajikistan
-
 Tanzania
-
 Thailand
-
 Trinidad and Tobago
-
 Tunisia
-
 Turkey
-
 UAE
-
 Uganda
-
 Ukraine
-
 United Kingdom
-
United States
-
 Uruguay
-
 Uzbekistan
-
 Venezuela
-
 Vietnam
-
 Yemen
-
 Zambia
-
 Zimbabwe
- Forex
- Crypto












