


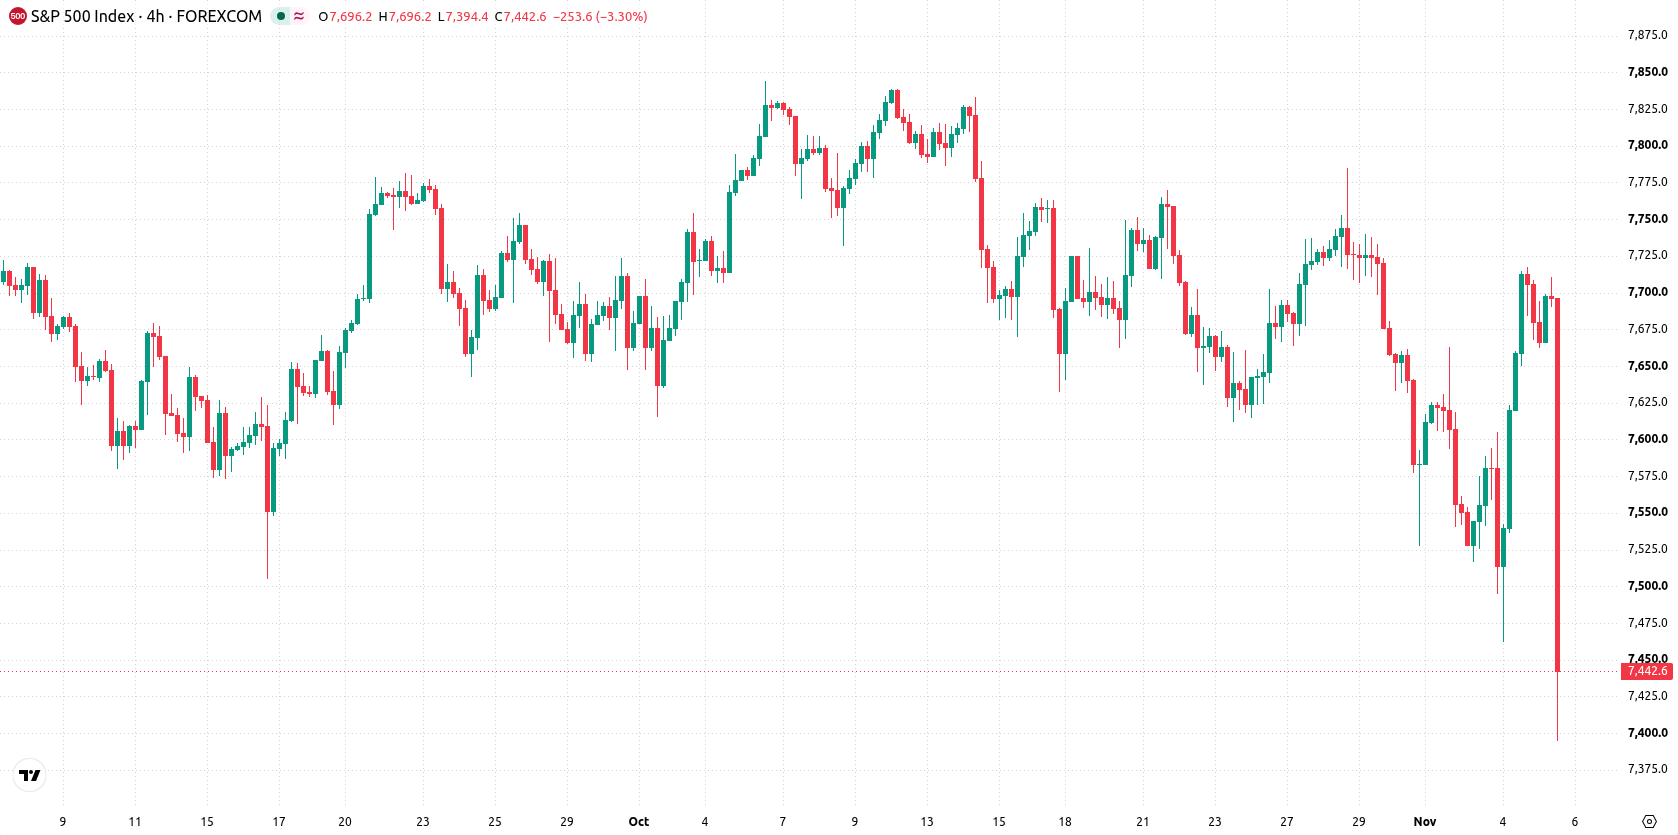
S&P 500 Index (SPX) dropped 3.21% as renewed downside pressure took hold, even as robust third-quarter earnings growth and strong technology sector performance continued to provide a fundamentally positive backdrop. The move is supported by SPX trading below its 20-day and 50-day moving averages, with technical signals indicating pronounced short- and medium-term weakness.
 7444.20
7714.32
Highlights
- S&P 500 third-quarter 2026 earnings grew 24.8% to 33% year-over-year, surpassing analyst expectations mainly on strong technology sector performance.
- About 60% of S&P 500 components remain in bear-market territory even as the index approaches record highs, with Okta added to the index in October 2026.
- The index is trading below key short- and medium-term averages under selling pressure, with a next five-day range forecast of 7,276 to 7,535 and trend signals mixed.
Index resilience offset by tech cash flow concerns and fund rebalancing effects
The S&P 500 reported strong third-quarter 2026 earnings growth, with year-over-year increases between 24.8% and 33% that generally exceeded analyst expectations. This was primarily due to strong technology sector results and broader profit expansion, though some cash flow weakness was noted at major tech firms, such as Alphabet and Amazon. In October 2026, Okta was added as a new S&P 500 constituent, prompting ETF and fund rebalancing. About 60% of the S&P 500's components remained in bear-market territory, even as the index approached record highs, though price action has remained under broader selling pressure.
Mixed momentum persists as SPX tests support amid volatility
SPX is trading below both its 20-day and 50-day moving averages (7,699 and 7,692), indicating short- and medium-term downside pressure, with the long-term trend still bullish as the index remains above its 200-day MA (7,320). The nearest support stands at 7,320, with resistance at 7,527. Momentum signals are mixed: the MACD maintains a sell bias, while the ADX is neutral, suggesting weak trend strength. RSI and CCI both remain neutral, although the Stochastic RSI is in the overbought zone, highlighting possible short-term correction risk. Bull/Bear Power shows buyers maintain intraday dominance, despite heavy pressure following a downside gap at the open. Intraday volatility measures 1.94%.
Earlier, analysts noted that the S&P 500 faced an environment of heightened policy uncertainty and was expected to remain range-bound in the wake of significant legislative shifts. The current analysis adds a fundamental perspective with robust earnings growth and pronounced sector performance, reinforcing the importance of monitoring 7,527 as a key resistance level that could signal a shift in the prevailing sideways trend.











-
 Afghanistan
-
 Albania
-
 Algeria
-
 Angola
-
 Argentina
-
 Armenia
-
 Australia
-
 Austria
-
 Azerbaijan
-
 Bahamas
-
 Bahrain
-
 Bangladesh
-
 Belarus
-
 Belgium
-
 Bolivia
-
 Botswana
-
 Brazil
-
 Brunei
-
 Bulgaria
-
 Cambodia
-
 Cameroon
-
 Canada
-
 Chile
-
 China
-
 Colombia
-
 Congo
-
 Costa Rica
-
 Cote d'Ivoire
-
 Croatia
-
 Cuba
-
 Cyprus
-
 Czechia
-
 DR Congo
-
 Denmark
-
 Dominican Republic
-
 Ecuador
-
 Egypt
-
 El Salvador
-
 Estonia
-
 Eswatini
-
 Ethiopia
-
 Finland
-
 France
-
 Georgia
-
 Germany
-
 Ghana
-
 Greece
-
 Haiti
-
 Hong Kong
-
 Hungary
-
 India
-
 Indonesia
-
 Iran, Islamic republic
-
 Iraq
-
 Ireland
-
 Israel
-
 Italy
-
 Jamaica
-
 Japan
-
 Jordan
-
 Kazakhstan
-
 Kenya
-
 Korea
-
 Kuwait
-
 Kyrgyzstan
-
 Laos
-
 Latvia
-
 Lebanon
-
 Lesotho
-
 Libya
-
 Lithuania
-
 Luxembourg
-
 Madagascar
-
 Malaysia
-
 Malta
-
 Mauritius
-
 Mexico
-
 Moldova
-
 Mongolia
-
 Montenegro
-
 Morocco
-
 Mozambique
-
 Myanmar
-
 Namibia
-
 Nepal
-
 Netherlands
-
 New Zealand
-
 Nigeria
-
 North Macedonia
-
 Norway
-
 Oman
-
 Pakistan
-
 Palestine
-
 Panama
-
 Papua New Guinea
-
 Paraguay
-
 Peru
-
 Philippines
-
 Poland
-
 Portugal
-
 Puerto Rico
-
 Qatar
-
 Reunion
-
 Romania
-
 Rwanda
-
 Saudi Arabia
-
 Serbia
-
 Singapore
-
 Slovakia
-
 Slovenia
-
 Somalia
-
 South Africa
-
 Spain
-
 Sri Lanka
-
 Sweden
-
 Switzerland
-
 Syria
-
 Taiwan
-
 Tajikistan
-
 Tanzania
-
 Thailand
-
 Trinidad and Tobago
-
 Tunisia
-
 Turkey
-
 UAE
-
 Uganda
-
 Ukraine
-
 United Kingdom
-
United States
-
 Uruguay
-
 Uzbekistan
-
 Venezuela
-
 Vietnam
-
 Yemen
-
 Zambia
-
 Zimbabwe
- Forex
- Crypto












