

FTSE 100 index posts downward price move while sellers maintain control

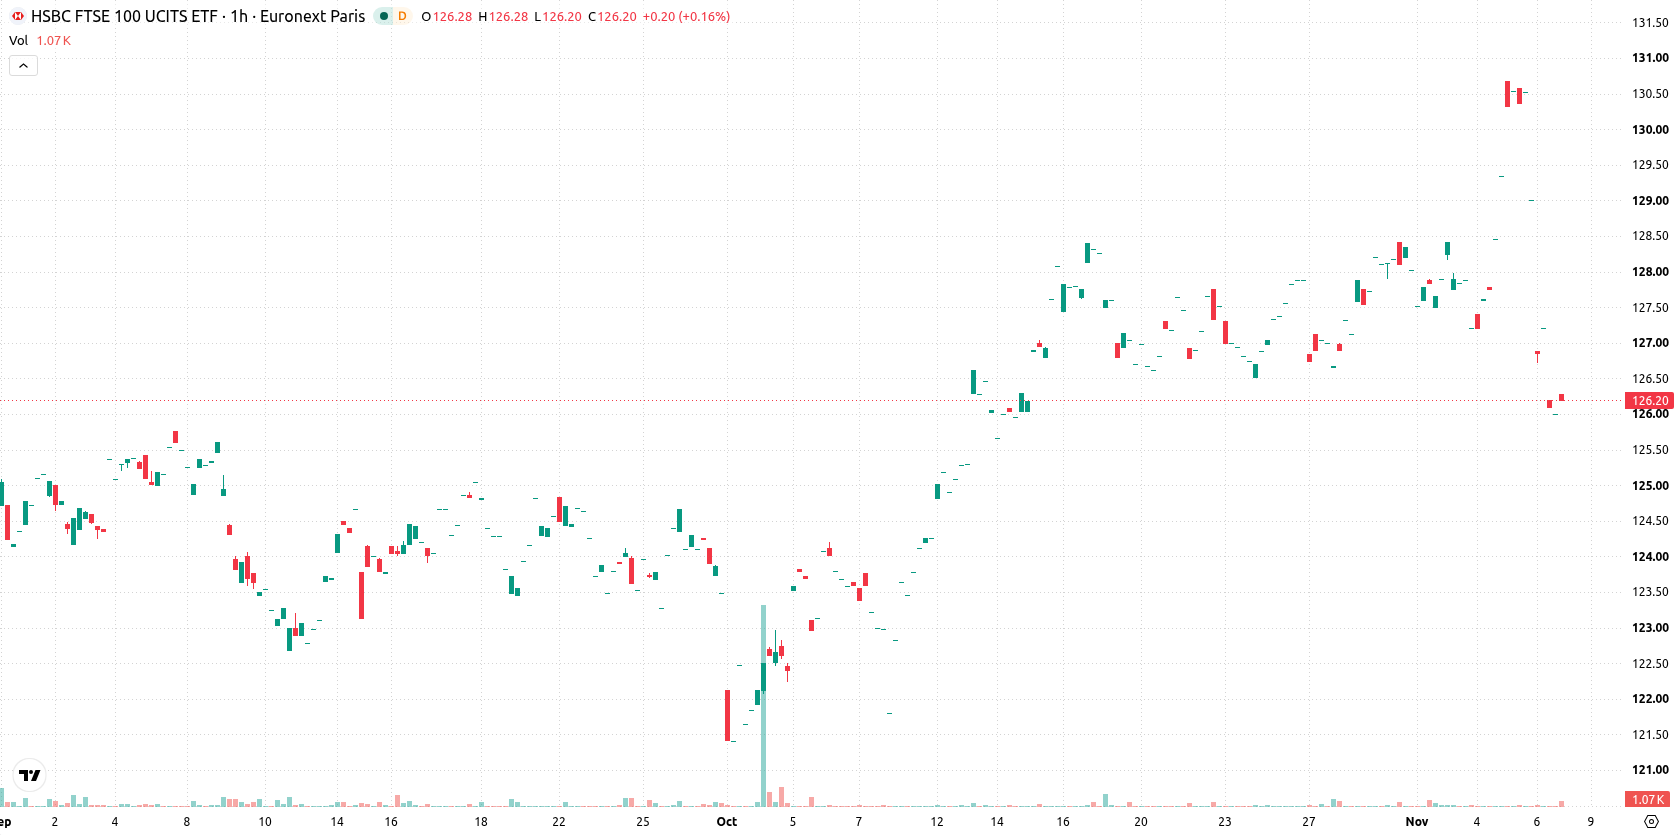
FTSE 100 (UKX) is trading at 10,558, down 2.08% for the session. The index sits below its primary short- and medium-term moving averages, while remaining above its longer-term average.
 10749.73
10946.26
Highlights
- The Bank of England raised its policy rate to 4% on November 5, 2026, tightening liquidity in UK markets and pressuring risk assets.
- A sharp sell-off in US technology stocks spread globally, reversing a previous multi-month high for the FTSE 100 and impacting UK equities.
- The FTSE 100 faces strong seller pressure with negative momentum signals and a projected range of 10,450 to 10,629 over the next 2 to 3 days.
Rate hike and tech sell-off fuel shift from risk assets
The Bank of England raised its policy rate to 4% on November 5, 2026, tightening liquidity conditions and exerting broad pressure on risk assets across the UK market. This policy move was accompanied by a sharp technology sector sell-off in US markets, which spread globally and contributed to negative sentiment for equities. Previously, the FTSE 100 had reached a multi-month high on the back of UK banking sector gains and a strong performance from Diageo, but this momentum was quickly reversed following the central bank decision and broader macro developments.
Downside momentum intensifies as sell signals and oversold readings align
Technically, the index is positioned below the MA-20 and MA-50 on the hourly chart, with price still above the MA-200 on the daily timeframe. The immediate resistance stands at the Ichimoku Kijun level of 10,738, while the nearest support zone lies below current levels. Momentum indicators such as MACD and ADX remain on sell signals, and both RSI and Stoch RSI confirm oversold conditions alongside a negative CCI reading. Bull/Bear Power is strongly negative, reinforcing seller dominance, and the Awesome Oscillator confirms prevailing downside momentum.
Downtrend risk dominates as breakout awaits directional catalyst
Over the next 2–3 trading days, price action in UKX is expected to range between 10,450 and 10,629, reflecting typical volatility relative to current levels. There is a 25% probability of an upward move, making a continuation to the downside much more probable. If the price consolidates within this band, a period of sideways movement may follow; a clear bullish reversal would require a break above immediate resistance, while a move below the support zone could trigger further selling.
Previously it was reported that analysts viewed the FTSE 100 as technically well-supported with prospects for further upside momentum. However, the current environment reflects a notable reversal, with the index now vulnerable to further downside risk unless price reclaims key moving averages, making the next decisive move likely to follow a test of support below current levels.






Latest FTSE 100 News




-
 Afghanistan
-
 Albania
-
 Algeria
-
 Angola
-
 Argentina
-
 Armenia
-
 Australia
-
 Austria
-
 Azerbaijan
-
 Bahamas
-
 Bahrain
-
 Bangladesh
-
 Belarus
-
 Belgium
-
 Bolivia
-
 Botswana
-
 Brazil
-
 Brunei
-
 Bulgaria
-
 Cambodia
-
 Cameroon
-
 Canada
-
 Chile
-
 China
-
 Colombia
-
 Congo
-
 Costa Rica
-
 Cote d'Ivoire
-
 Croatia
-
 Cuba
-
 Cyprus
-
 Czechia
-
 DR Congo
-
 Denmark
-
 Dominican Republic
-
 Ecuador
-
 Egypt
-
 El Salvador
-
 Estonia
-
 Eswatini
-
 Ethiopia
-
 Finland
-
 France
-
 Georgia
-
 Germany
-
 Ghana
-
 Greece
-
 Haiti
-
 Hong Kong
-
 Hungary
-
 India
-
 Indonesia
-
 Iran, Islamic republic
-
 Iraq
-
 Ireland
-
 Israel
-
 Italy
-
 Jamaica
-
 Japan
-
 Jordan
-
 Kazakhstan
-
 Kenya
-
 Korea
-
 Kuwait
-
 Kyrgyzstan
-
 Laos
-
 Latvia
-
 Lebanon
-
 Lesotho
-
 Libya
-
 Lithuania
-
 Luxembourg
-
 Madagascar
-
 Malaysia
-
 Malta
-
 Mauritius
-
 Mexico
-
 Moldova
-
 Mongolia
-
 Montenegro
-
 Morocco
-
 Mozambique
-
 Myanmar
-
 Namibia
-
 Nepal
-
 Netherlands
-
 New Zealand
-
 Nigeria
-
 North Macedonia
-
 Norway
-
 Oman
-
 Pakistan
-
 Palestine
-
 Panama
-
 Papua New Guinea
-
 Paraguay
-
 Peru
-
 Philippines
-
 Poland
-
 Portugal
-
 Puerto Rico
-
 Qatar
-
 Reunion
-
 Romania
-
 Rwanda
-
 Saudi Arabia
-
 Serbia
-
 Singapore
-
 Slovakia
-
 Slovenia
-
 Somalia
-
 South Africa
-
 Spain
-
 Sri Lanka
-
 Sweden
-
 Switzerland
-
 Syria
-
 Taiwan
-
 Tajikistan
-
 Tanzania
-
 Thailand
-
 Trinidad and Tobago
-
 Tunisia
-
 Turkey
-
 UAE
-
 Uganda
-
 Ukraine
-
 United Kingdom
-
United States
-
 Uruguay
-
 Uzbekistan
-
 Venezuela
-
 Vietnam
-
 Yemen
-
 Zambia
-
 Zimbabwe
- Forex
- Crypto












