


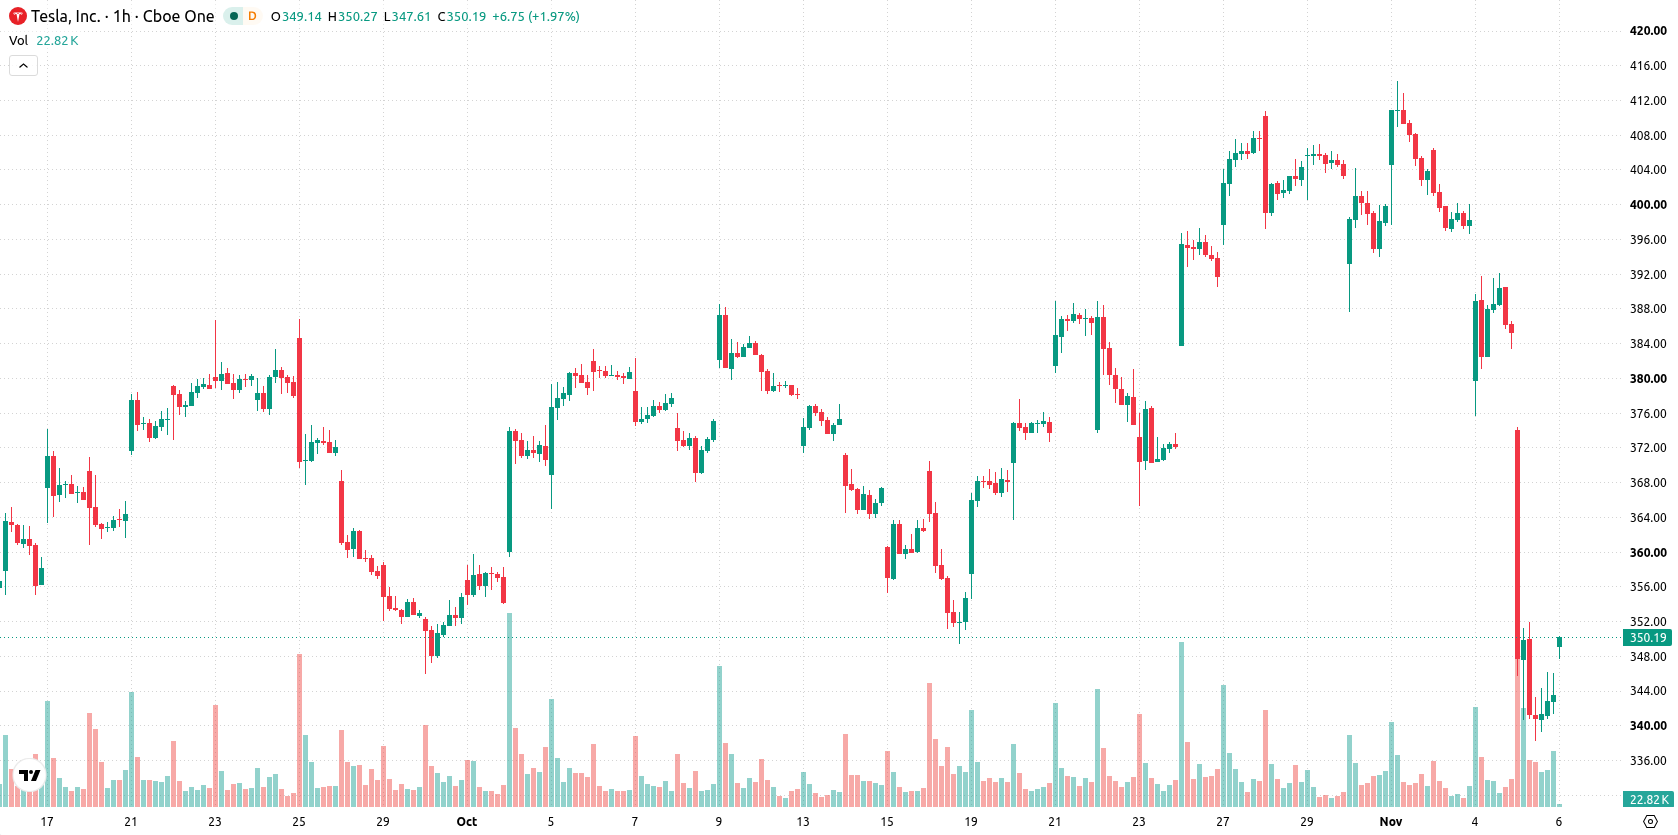
Tesla (TSLA) stock is trading at $342.9, marking a decline of 10.98% for the session. The price currently sits below its key moving averages, reflecting strong downward momentum on the day.
 363.84
414.17
Highlights
- Democrats won control of both houses of Congress and the Texas governorship, raising expectations of US regulatory scrutiny for Tesla and risk to a possible SpaceX merger.
- Tesla and SpaceX have established special committees to evaluate merger options, but no terms are finalized and outcomes remain uncertain.
- Shares of Tesla closed at $342.9, down 10.98% on high volatility, with technical indicators confirming bearish conditions and a projected near-term range of $309.02 to $376.78.
Regulatory risk and merger uncertainty grip Tesla amid Democratic sweep
The Democratic Party's sweeping victory in the U.S. midterm elections on November 5, 2026, raised investor concerns about increased regulatory scrutiny for Tesla as well as heightened risks surrounding a potential merger with SpaceX, according to Investing.com. Elon Musk further confirmed on the same day that special committees at Tesla and SpaceX are analyzing a possible merger, though no transaction terms have been decided and the deal remains uncertain, as reported by Channelnewsasia. This environment of political realignment, including Democrats' control of both houses of Congress and the Texas governorship as noted by TradingKey, has contributed to pronounced uncertainty over Tesla's future corporate strategy and operating landscape.
Technical breakdown deepens amid persistent oversold signals
TSLA remains under pressure, trading below the MA-20 and MA-50 on the working timeframe and also below the MA-200 on the daily chart. The Ichimoku Kijun at $375.52 acts as immediate resistance. Both MACD and ADX are signaling sell conditions, while the RSI, Stoch RSI, and CCI are all in their respective oversold zones, which suggests exhaustion among sellers but does not guarantee a reversal. Bull/Bear Power is firmly negative, indicating continued dominance by intraday sellers, and the Awesome Oscillator is neutral, failing to reinforce the prevailing momentum.
Downside scenario favored as volatility and resistance converge
In the short term, TSLA is projected to trade within a range of $309.02 to $376.78, a volatility band relative to current levels. Forecasts indicate a 70% probability of further downside and a 30% chance of a rebound, suggesting that additional declines are more likely unless resistance at recent highs is breached. If sellers succeed in pushing the price below support, the downtrend could accelerate; otherwise, the baseline scenario sees stabilization within the stated range.
Earlier, analysts noted that Scottish Mortgage Investment Trust had fully exited its Tesla position, emphasizing portfolio rebalancing amid significant changes to its major holdings. Recent volatility surrounding Tesla, heightened by political developments and merger uncertainties, underscores the importance for traders to monitor the $309.02–$376.78 range as a zone where directional momentum could shift.






Latest Tesla News





-
 Afghanistan
-
 Albania
-
 Algeria
-
 Angola
-
 Argentina
-
 Armenia
-
 Australia
-
 Austria
-
 Azerbaijan
-
 Bahamas
-
 Bahrain
-
 Bangladesh
-
 Belarus
-
 Belgium
-
 Bolivia
-
 Botswana
-
 Brazil
-
 Brunei
-
 Bulgaria
-
 Cambodia
-
 Cameroon
-
 Canada
-
 Chile
-
 China
-
 Colombia
-
 Congo
-
 Costa Rica
-
 Cote d'Ivoire
-
 Croatia
-
 Cuba
-
 Cyprus
-
 Czechia
-
 DR Congo
-
 Denmark
-
 Dominican Republic
-
 Ecuador
-
 Egypt
-
 El Salvador
-
 Estonia
-
 Eswatini
-
 Ethiopia
-
 Finland
-
 France
-
 Georgia
-
 Germany
-
 Ghana
-
 Greece
-
 Haiti
-
 Hong Kong
-
 Hungary
-
 India
-
 Indonesia
-
 Iran, Islamic republic
-
 Iraq
-
 Ireland
-
 Israel
-
 Italy
-
 Jamaica
-
 Japan
-
 Jordan
-
 Kazakhstan
-
 Kenya
-
 Korea
-
 Kuwait
-
 Kyrgyzstan
-
 Laos
-
 Latvia
-
 Lebanon
-
 Lesotho
-
 Libya
-
 Lithuania
-
 Luxembourg
-
 Madagascar
-
 Malaysia
-
 Malta
-
 Mauritius
-
 Mexico
-
 Moldova
-
 Mongolia
-
 Montenegro
-
 Morocco
-
 Mozambique
-
 Myanmar
-
 Namibia
-
 Nepal
-
 Netherlands
-
 New Zealand
-
 Nigeria
-
 North Macedonia
-
 Norway
-
 Oman
-
 Pakistan
-
 Palestine
-
 Panama
-
 Papua New Guinea
-
 Paraguay
-
 Peru
-
 Philippines
-
 Poland
-
 Portugal
-
 Puerto Rico
-
 Qatar
-
 Reunion
-
 Romania
-
 Rwanda
-
 Saudi Arabia
-
 Serbia
-
 Singapore
-
 Slovakia
-
 Slovenia
-
 Somalia
-
 South Africa
-
 Spain
-
 Sri Lanka
-
 Sweden
-
 Switzerland
-
 Syria
-
 Taiwan
-
 Tajikistan
-
 Tanzania
-
 Thailand
-
 Trinidad and Tobago
-
 Tunisia
-
 Turkey
-
 UAE
-
 Uganda
-
 Ukraine
-
 United Kingdom
-
United States
-
 Uruguay
-
 Uzbekistan
-
 Venezuela
-
 Vietnam
-
 Yemen
-
 Zambia
-
 Zimbabwe
- Forex
- Crypto












