


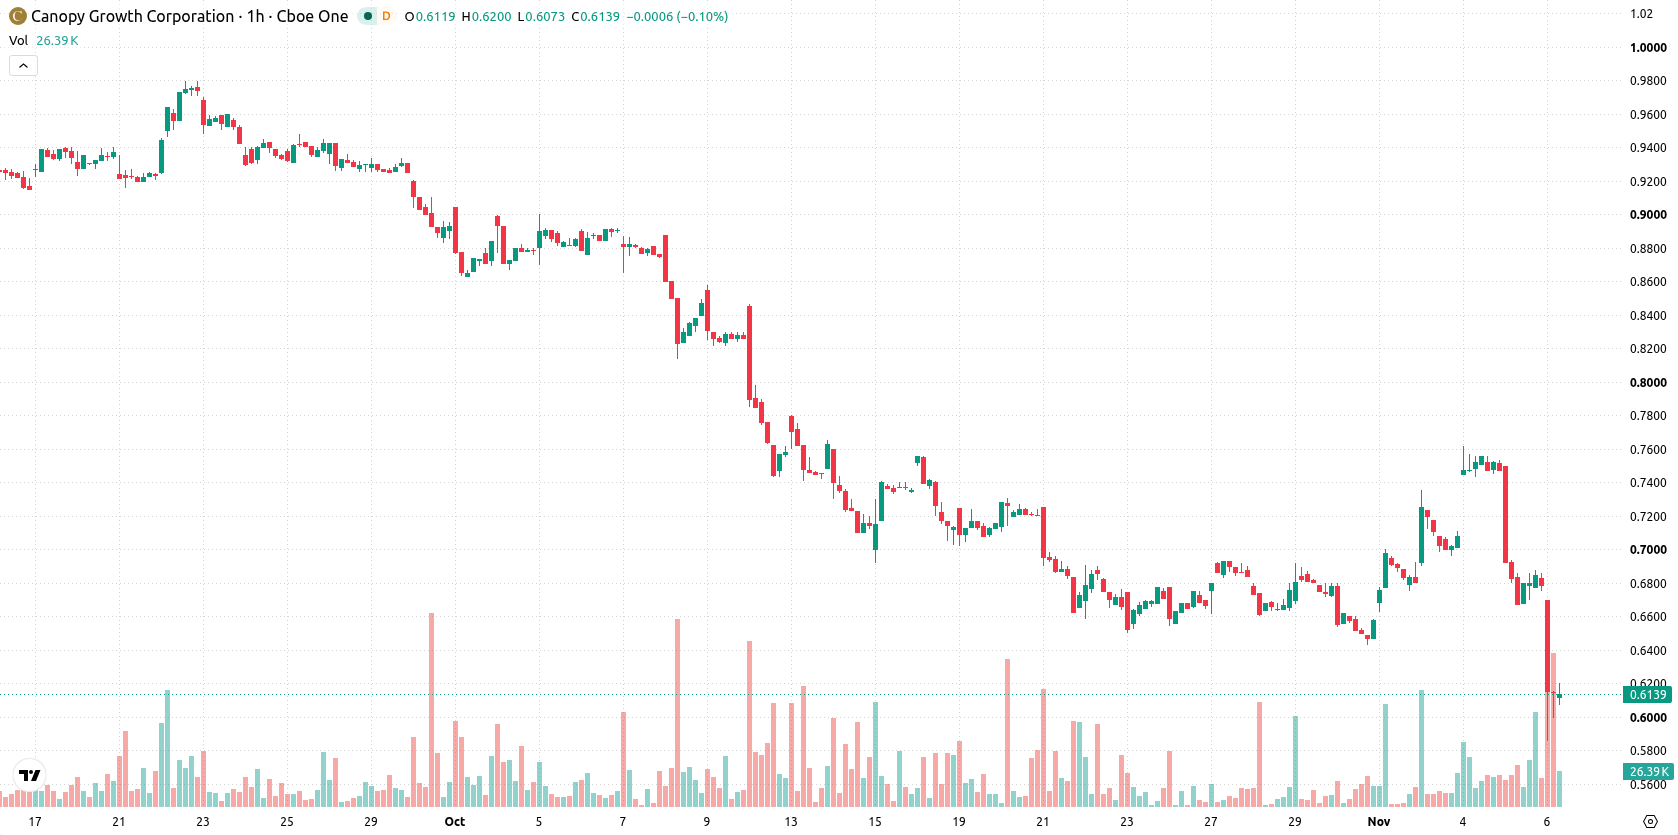
Canopy Growth (CGC) stock is trading at $0.6192 after falling 8.36% in today’s session. The price now sits below its key moving averages and continues to show sustained downward momentum on elevated volatility.
 0.6835
0.7597
Highlights
- Canopy Growth net revenue grew 22% year over year to C$81.4 million, driven by a 141% surge in international cannabis sales.
- Liquidity declined by $117 million over six months, with a C$193 million debt default risk tied to Acreage and Wana assets unresolved ahead of January 2027.
- Shares of Canopy Growth trade below key moving averages with bearish momentum, expected to move between $0.57 and $0.68 as oversold conditions persist.
Revenue gains offset by liquidity decline and default risk
Canopy Growth reported a 22% year-over-year increase in net revenue for its fiscal second quarter to C$81.4 million, with sales momentum fueled by a 141% jump in international cannabis revenue, particularly in Germany and Poland. Despite this, the company’s liquidity declined by $117 million over the past six months, and a material debt default risk of C$193 million tied to Acreage and Wana assets remains unresolved ahead of a January 2027 forbearance deadline. Operationally, adjusted EBITDA loss narrowed 6% to C$2.9 million and free cash outflows improved to C$15.5 million, but restricted cash stood at US$840.6 million and internal control weaknesses related to equity-linked instruments continue to be remediated. These developments offer mixed signals for operational progress yet leave substantial financial and structural risks unresolved, which has coincided with persistent selling pressure in the market.
Oversold signals increase rebound risk amid firm bearish bias
On the hourly chart, CGC is positioned below the MA-20 at $0.7, MA-50 at $0.69, and MA-200 at $0.99, while the Ichimoku Kijun resistance is set at $0.67. Momentum remains firmly negative as both MACD and ADX confirm persistent bearish bias. Intraday oscillators—RSI, Stoch RSI, and CCI—are all reading in oversold territory, highlighting elevated risk of short-term rebound but no confirmed trend reversal. Bull/Bear Power remains negative at -0.06, further supporting sustained selling activity, and the Awesome Oscillator aligns with the prevailing downward momentum.
Sideways range likely as downside risk outweighs bullish triggers
In the coming sessions, CGC is expected to remain volatile within a projected range of $0.57 to $0.68. Immediate upward movement is statistically unlikely, while downside risk predominates. Baseline expectations call for sideways movement between defined support and resistance; a close above $0.67 would be required to trigger a bullish breakout, while a move below $0.57 would likely result in further weakness.
Earlier, analysts noted that downside risks outweighed breakout potential for Canopy Growth, with technical indicators suggesting a bias toward further weakness. The current analysis reinforces this view, as persistent negative momentum and unresolved financial risks keep the focus on downside volatility, making $0.57 a critical support level for traders to monitor.










-
 Afghanistan
-
 Albania
-
 Algeria
-
 Angola
-
 Argentina
-
 Armenia
-
 Australia
-
 Austria
-
 Azerbaijan
-
 Bahamas
-
 Bahrain
-
 Bangladesh
-
 Belarus
-
 Belgium
-
 Bolivia
-
 Botswana
-
 Brazil
-
 Brunei
-
 Bulgaria
-
 Cambodia
-
 Cameroon
-
 Canada
-
 Chile
-
 China
-
 Colombia
-
 Congo
-
 Costa Rica
-
 Cote d'Ivoire
-
 Croatia
-
 Cuba
-
 Cyprus
-
 Czechia
-
 DR Congo
-
 Denmark
-
 Dominican Republic
-
 Ecuador
-
 Egypt
-
 El Salvador
-
 Estonia
-
 Eswatini
-
 Ethiopia
-
 Finland
-
 France
-
 Georgia
-
 Germany
-
 Ghana
-
 Greece
-
 Haiti
-
 Hong Kong
-
 Hungary
-
 India
-
 Indonesia
-
 Iran, Islamic republic
-
 Iraq
-
 Ireland
-
 Israel
-
 Italy
-
 Jamaica
-
 Japan
-
 Jordan
-
 Kazakhstan
-
 Kenya
-
 Korea
-
 Kuwait
-
 Kyrgyzstan
-
 Laos
-
 Latvia
-
 Lebanon
-
 Lesotho
-
 Libya
-
 Lithuania
-
 Luxembourg
-
 Madagascar
-
 Malaysia
-
 Malta
-
 Mauritius
-
 Mexico
-
 Moldova
-
 Mongolia
-
 Montenegro
-
 Morocco
-
 Mozambique
-
 Myanmar
-
 Namibia
-
 Nepal
-
 Netherlands
-
 New Zealand
-
 Nigeria
-
 North Macedonia
-
 Norway
-
 Oman
-
 Pakistan
-
 Palestine
-
 Panama
-
 Papua New Guinea
-
 Paraguay
-
 Peru
-
 Philippines
-
 Poland
-
 Portugal
-
 Puerto Rico
-
 Qatar
-
 Reunion
-
 Romania
-
 Rwanda
-
 Saudi Arabia
-
 Serbia
-
 Singapore
-
 Slovakia
-
 Slovenia
-
 Somalia
-
 South Africa
-
 Spain
-
 Sri Lanka
-
 Sweden
-
 Switzerland
-
 Syria
-
 Taiwan
-
 Tajikistan
-
 Tanzania
-
 Thailand
-
 Trinidad and Tobago
-
 Tunisia
-
 Turkey
-
 UAE
-
 Uganda
-
 Ukraine
-
 United Kingdom
-
United States
-
 Uruguay
-
 Uzbekistan
-
 Venezuela
-
 Vietnam
-
 Yemen
-
 Zambia
-
 Zimbabwe
- Forex
- Crypto












