


Intel Corporation (INTC) jumped 8.75% after a surge in buying interest, following confirmed insider stock purchases and a relief rally after recent earnings-driven volatility. The rebound looks limited, with the move occurring while the stock remains below its 20-day, 50-day, and 200-day moving averages, signaling ongoing broader downward pressure.
 57.32
64.75
Highlights
- Intel reported third-quarter 2026 revenue of $16.51 billion, a 21% year-over-year increase driven by data center sales.
- Shares of Intel fell and shareholder rights investigations were initiated into potential securities law violations following the earnings release.
- Intel stock remains under bearish pressure below near-term resistance at $63.1, with a 5-day expected range of $50.46 to $63.1 and strong selling signals from technical indicators.
Investor scrutiny intensifies after mixed earnings and CEO share purchase
Intel Corporation reported its third-quarter 2026 results on October 29, with revenue rising to $16.51 billion, a 21% increase year over year and gains in data center sales, while PC chip sales remained weak. Following the earnings release, Intel shares experienced sharp declines, accompanied by the initiation of shareholder rights investigations into potential securities law violations. CEO Lip-Bu Tan purchased 150,000 shares for about $9.7 million on November 2, and trading was further influenced by a sector-wide semiconductor recovery.
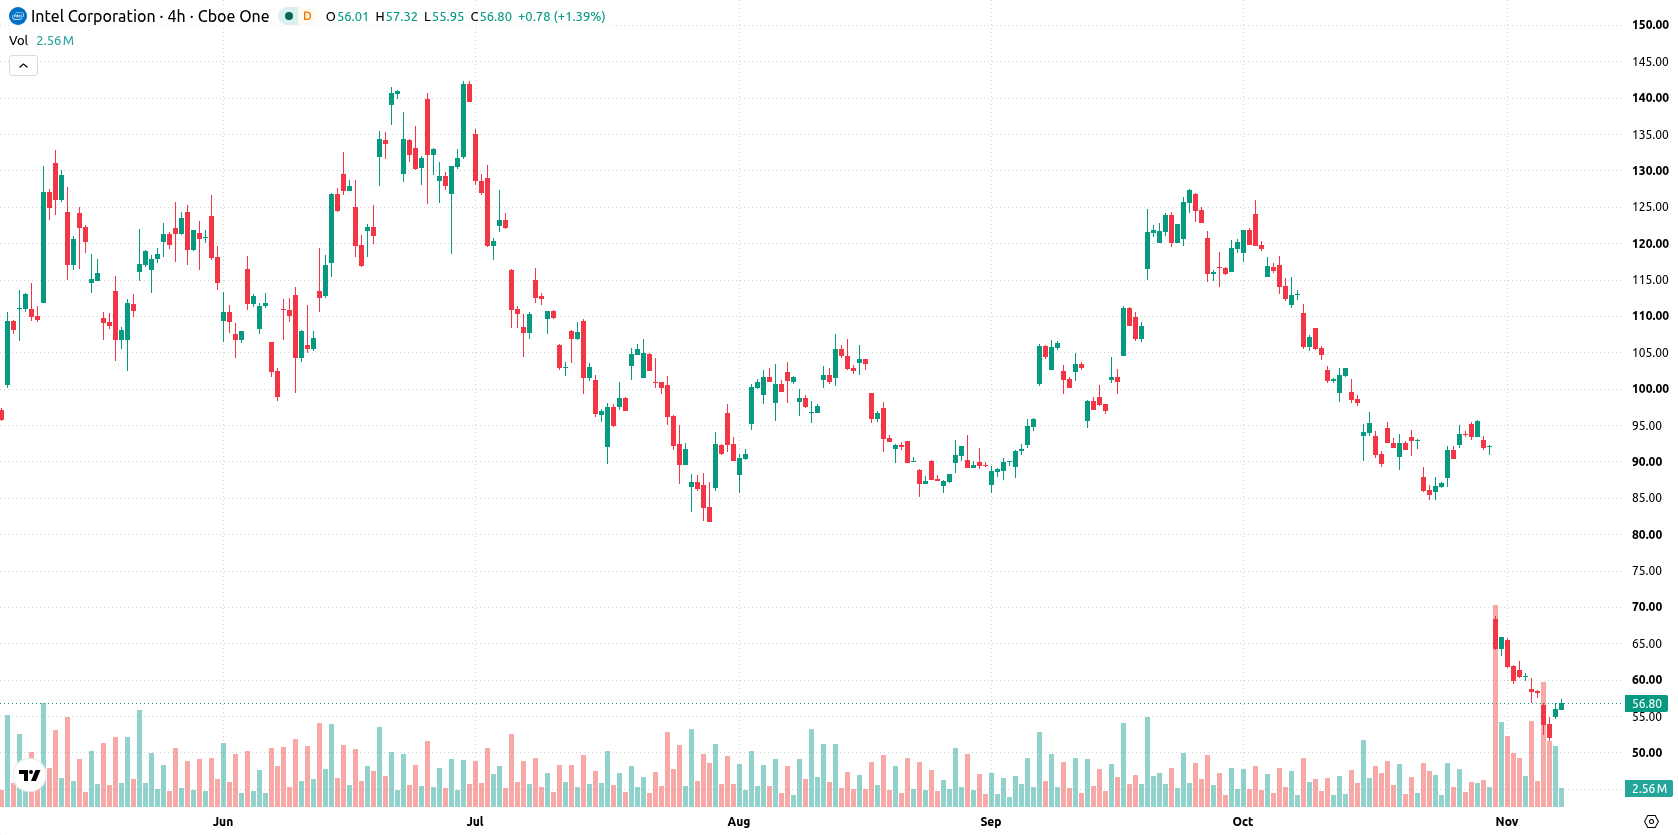
Persistent downtrend signals as support erodes amid selling exhaustion
Intel is trading below its 20-day, 50-day, and 200-day moving averages ($85.58, $98.69, and $87.02, respectively), which signals persistent downward momentum across all timeframes. Nearest resistance stands at $63.1 and support at $55.9; more distant moving averages and the Ichimoku Kijun ($89.19) confirm the broader bearish technical structure, though they are not directly relevant to immediate price action. Momentum indicators show a strongly bearish profile: the MACD and ADX indicate active selling pressure, while the RSI, Stochastic RSI, and CCI are all firmly in oversold zones, highlighting ongoing selling exhaustion risks. Bull/Bear Power (BBP) remains negative, and the Awesome Oscillator is in line with prevailing bearish momentum, even as today's session saw a notable upside gap and high volatility.
Previously it was reported that Intel faced persistent downside risk following weak revenue guidance and ongoing technical weakness. The latest analysis reinforces this outlook, with Intel continuing to exhibit a bearish technical structure and a 79% probability of downside movement, making the $63.1 resistance level critical to watch for any potential shift in near-term price action.









-
 Afghanistan
-
 Albania
-
 Algeria
-
 Angola
-
 Argentina
-
 Armenia
-
 Australia
-
 Austria
-
 Azerbaijan
-
 Bahamas
-
 Bahrain
-
 Bangladesh
-
 Belarus
-
 Belgium
-
 Bolivia
-
 Botswana
-
 Brazil
-
 Brunei
-
 Bulgaria
-
 Cambodia
-
 Cameroon
-
 Canada
-
 Chile
-
 China
-
 Colombia
-
 Congo
-
 Costa Rica
-
 Cote d'Ivoire
-
 Croatia
-
 Cuba
-
 Cyprus
-
 Czechia
-
 DR Congo
-
 Denmark
-
 Dominican Republic
-
 Ecuador
-
 Egypt
-
 El Salvador
-
 Estonia
-
 Eswatini
-
 Ethiopia
-
 Finland
-
 France
-
 Georgia
-
 Germany
-
 Ghana
-
 Greece
-
 Haiti
-
 Hong Kong
-
 Hungary
-
 India
-
 Indonesia
-
 Iran, Islamic republic
-
 Iraq
-
 Ireland
-
 Israel
-
 Italy
-
 Jamaica
-
 Japan
-
 Jordan
-
 Kazakhstan
-
 Kenya
-
 Korea
-
 Kuwait
-
 Kyrgyzstan
-
 Laos
-
 Latvia
-
 Lebanon
-
 Lesotho
-
 Libya
-
 Lithuania
-
 Luxembourg
-
 Madagascar
-
 Malaysia
-
 Malta
-
 Mauritius
-
 Mexico
-
 Moldova
-
 Mongolia
-
 Montenegro
-
 Morocco
-
 Mozambique
-
 Myanmar
-
 Namibia
-
 Nepal
-
 Netherlands
-
 New Zealand
-
 Nigeria
-
 North Macedonia
-
 Norway
-
 Oman
-
 Pakistan
-
 Palestine
-
 Panama
-
 Papua New Guinea
-
 Paraguay
-
 Peru
-
 Philippines
-
 Poland
-
 Portugal
-
 Puerto Rico
-
 Qatar
-
 Reunion
-
 Romania
-
 Rwanda
-
 Saudi Arabia
-
 Serbia
-
 Singapore
-
 Slovakia
-
 Slovenia
-
 Somalia
-
 South Africa
-
 Spain
-
 Sri Lanka
-
 Sweden
-
 Switzerland
-
 Syria
-
 Taiwan
-
 Tajikistan
-
 Tanzania
-
 Thailand
-
 Trinidad and Tobago
-
 Tunisia
-
 Turkey
-
 UAE
-
 Uganda
-
 Ukraine
-
 United Kingdom
-
United States
-
 Uruguay
-
 Uzbekistan
-
 Venezuela
-
 Vietnam
-
 Yemen
-
 Zambia
-
 Zimbabwe
- Forex
- Crypto












