

Abbott Laboratories stock weekly forecast: Overbought signals raise pullback risk

Shares of Abbott Laboratories (ABT) are trading near $110 after gaining roughly 3.5% over the past week, as a burst of corporate headlines shaped sentiment. A steady rally in ABT faces a test as overbought technical readings raise questions about whether recent upside can hold into next week.
 110.75
116.99
Highlights
- Shares of Abbott Laboratories rose 3.47% over the past week and trade well above key moving averages.
- Technical indicators show a bullish trend structure, but overbought signals suggest possible near-term pullback risk.
- For the next five trading days, the expected range is $105.33 to $115.79 with 73% probability of an increase.
FDA approvals and business restructuring fuel mixed investor response this week
Abbott Laboratories advanced its medical device portfolio with the FDA approval of the Amplatzer Paraclose PVL Occluder, alongside positive clinical results for its investigational Amulet 360 occluder and SonicForce coronary IVL system, according to Yahoo Finance and Simply Wall St News. The company also launched the next-generation Oncodetect MRD cancer diagnostic, further expanding its cardiology and oncology offerings. Meanwhile, institutional investors showed mixed moves, with Pictet Asset Management and Bryn Mawr Trust Advisors raising their stakes, while others trimmed holdings, according to MarketBeat and Defense World. ABT confirmed plans to separate its Nutrition division into a standalone public entity by 2027, a move that could drive strategic changes ahead.
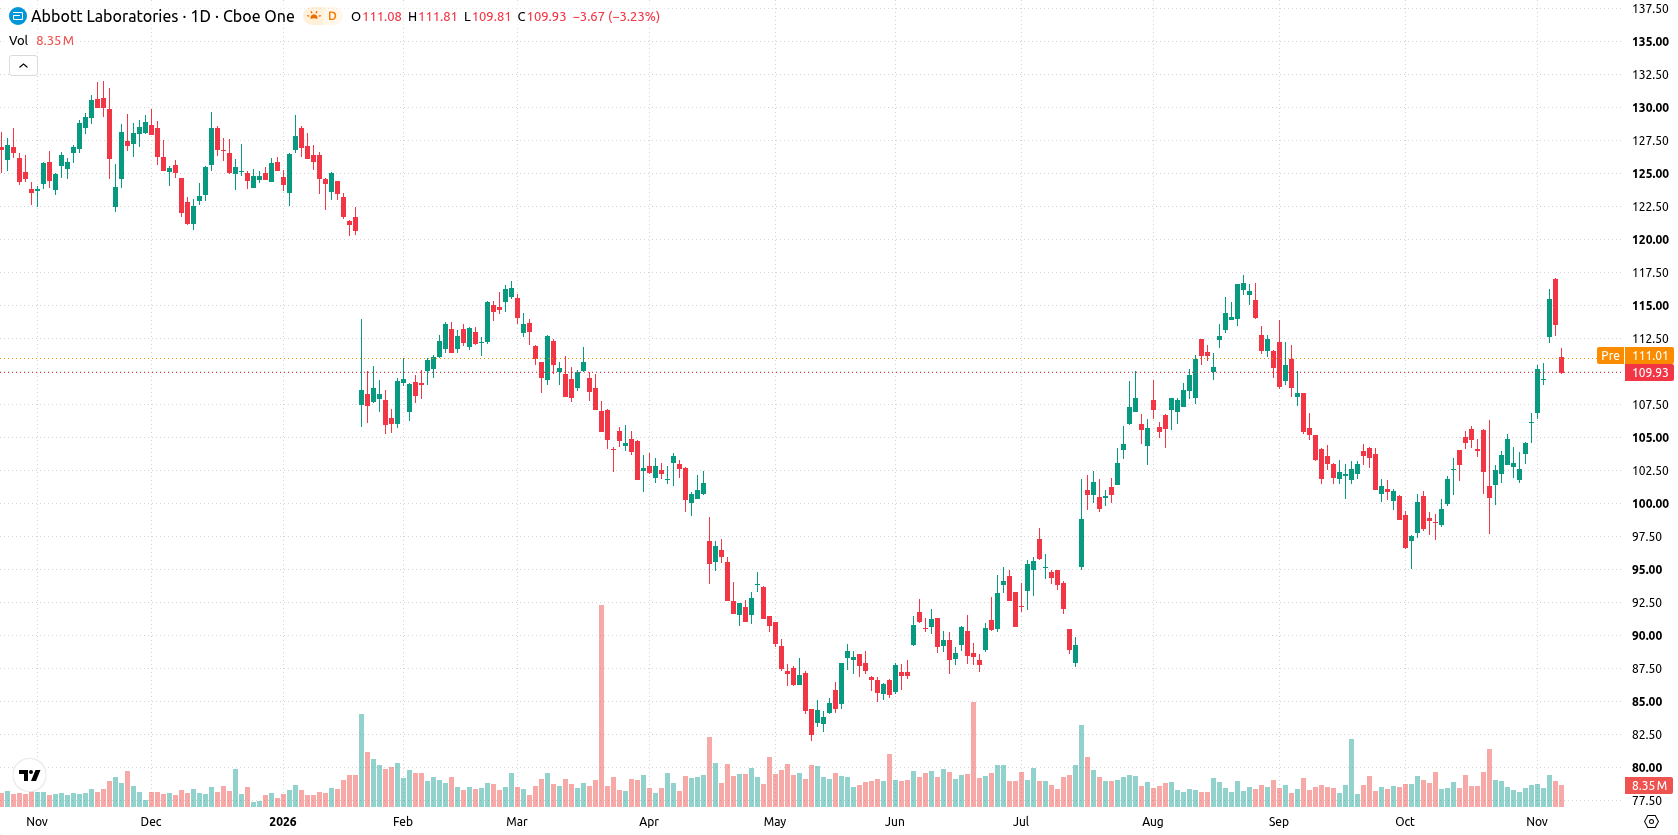
Bullish MACD and overbought CCI signal risk amid sustained volatility
On the daily chart, Abbott Laboratories has staged a sharp move higher without a sustained trend, supported by a volatility reading of 9.63%. The MACD gives a clear buy signal at 3.39, while the CCI is overbought at 106.38, which may signal potential for a near-term pullback despite broader upward momentum. Meanwhile, oscillator readings are mixed, as RSI and Stochastic RSI both remain neutral. Immediate support is seen at $106.71, while resistance comes in at $116.99, with the Ichimoku Kijun at $106.15 backing support levels.
Choppy consolidation expected as key levels shape upcoming week’s range
For the next five trading days, the expected range is $105.33 to $115.79. There is a 73% probability of an increase and a 27% probability of a decrease. The base case is choppy action within this range as momentum consolidates. A break above $116.99 could open up further gains, whereas a drop below $106.71 would raise downside risk toward the lower end of the expected range.
Earlier, analysts noted that Abbott Laboratories maintained a bullish technical bias despite caution around overbought indicators and potential for a short-term correction. The current article adds a new dimension by highlighting recent product developments and strategic moves, making the $116.99 resistance level the key threshold for traders to monitor in the coming sessions.









-
 Afghanistan
-
 Albania
-
 Algeria
-
 Angola
-
 Argentina
-
 Armenia
-
 Australia
-
 Austria
-
 Azerbaijan
-
 Bahamas
-
 Bahrain
-
 Bangladesh
-
 Belarus
-
 Belgium
-
 Bolivia
-
 Botswana
-
 Brazil
-
 Brunei
-
 Bulgaria
-
 Cambodia
-
 Cameroon
-
 Canada
-
 Chile
-
 China
-
 Colombia
-
 Congo
-
 Costa Rica
-
 Cote d'Ivoire
-
 Croatia
-
 Cuba
-
 Cyprus
-
 Czechia
-
 DR Congo
-
 Denmark
-
 Dominican Republic
-
 Ecuador
-
 Egypt
-
 El Salvador
-
 Estonia
-
 Eswatini
-
 Ethiopia
-
 Finland
-
 France
-
 Georgia
-
 Germany
-
 Ghana
-
 Greece
-
 Haiti
-
 Hong Kong
-
 Hungary
-
 India
-
 Indonesia
-
 Iran, Islamic republic
-
 Iraq
-
 Ireland
-
 Israel
-
 Italy
-
 Jamaica
-
 Japan
-
 Jordan
-
 Kazakhstan
-
 Kenya
-
 Korea
-
 Kuwait
-
 Kyrgyzstan
-
 Laos
-
 Latvia
-
 Lebanon
-
 Lesotho
-
 Libya
-
 Lithuania
-
 Luxembourg
-
 Madagascar
-
 Malaysia
-
 Malta
-
 Mauritius
-
 Mexico
-
 Moldova
-
 Mongolia
-
 Montenegro
-
 Morocco
-
 Mozambique
-
 Myanmar
-
 Namibia
-
 Nepal
-
 Netherlands
-
 New Zealand
-
 Nigeria
-
 North Macedonia
-
 Norway
-
 Oman
-
 Pakistan
-
 Palestine
-
 Panama
-
 Papua New Guinea
-
 Paraguay
-
 Peru
-
 Philippines
-
 Poland
-
 Portugal
-
 Puerto Rico
-
 Qatar
-
 Reunion
-
 Romania
-
 Rwanda
-
 Saudi Arabia
-
 Serbia
-
 Singapore
-
 Slovakia
-
 Slovenia
-
 Somalia
-
 South Africa
-
 Spain
-
 Sri Lanka
-
 Sweden
-
 Switzerland
-
 Syria
-
 Taiwan
-
 Tajikistan
-
 Tanzania
-
 Thailand
-
 Trinidad and Tobago
-
 Tunisia
-
 Turkey
-
 UAE
-
 Uganda
-
 Ukraine
-
 United Kingdom
-
United States
-
 Uruguay
-
 Uzbekistan
-
 Venezuela
-
 Vietnam
-
 Yemen
-
 Zambia
-
 Zimbabwe
- Forex
- Crypto












