

AMD shares technical analysis: Approaches $458.36 resistance after upward price move

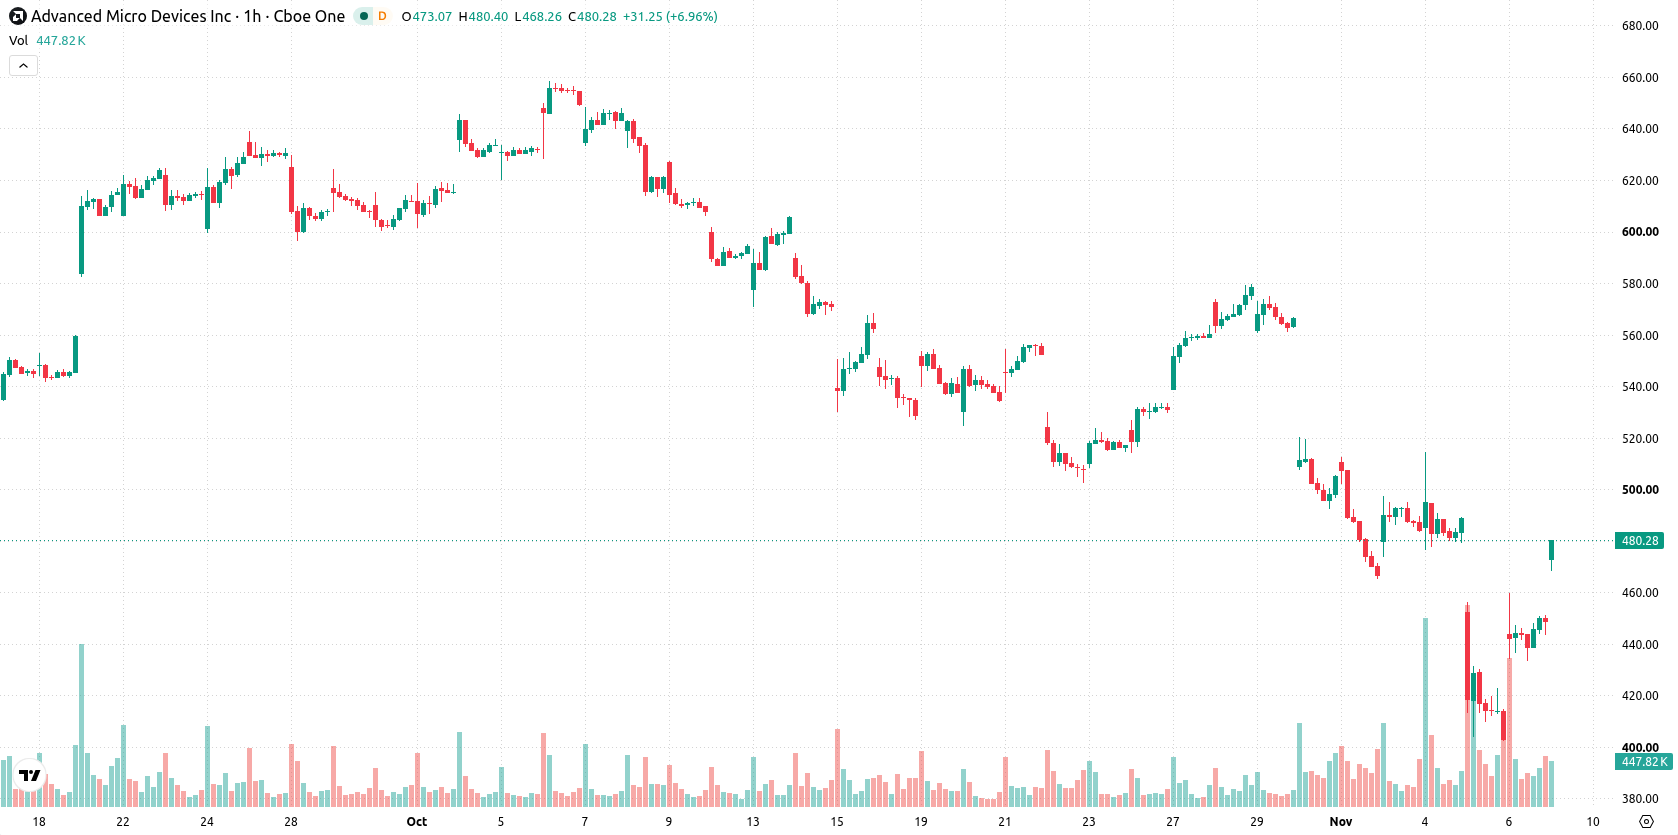
AMD (AMD) stock is trading at $448.01, up 10.78% on the day. The price sits above its key short-term moving average while remaining below its intermediate trend threshold, with longer-term support intact.
 559.18
593.63
Highlights
- M Holdings Securities Inc. acquired 5,191 shares of AMD, showing increased liquidity and professional investor demand for AMD stock.
- Fulcrum Asset Management LLP raised its AMD position by 49% in the third quarter, indicating ongoing institutional accumulation.
- AMD stock rose 10.78% to $448.01 with high volatility, but weak momentum indicators imply a 75% probability of a move to the $400.78 to $495.24 range on potential consolidation or downside.
Rising institutional interest as new positions boost liquidity
Institutional flows are providing a key catalyst for AMD, as M Holdings Securities Inc. has opened a new position in the company by acquiring 5,191 shares, according to MarketBeat. This direct investment injects new liquidity and signals rising demand from professional investors, which can play a significant role in stimulating further buying activity. Complementing this, Fulcrum Asset Management LLP's 49% increase in its AMD stake during the third quarter reflects broadening institutional accumulation and supports the positive momentum seen in the stock.
Upside momentum faces resistance as volatility and signals diverge
Technically, AMD surged by 10.78% to $448.01, forming a sizable upside gap of $49.46 and trading near the session high with high volatility. The price currently holds above the MA-20, remains below the MA-50, and stands above the MA-200. Immediate resistance is established by the Ichimoku Kijun at $458.36. Momentum indicators reveal conflicting signals: MACD issues a Strong Sell, ADX signals Sell, while Bull/Bear Power posts a positive 7.66 value signifying intraday buyer strength. RSI and CCI remain neutral, the Awesome Oscillator is flat, and the Stochastic RSI is overbought, indicating a risk of near-term pullback despite overall buyer dominance in the recent session.
Consolidation expected as downside risk outweighs bullish odds
For the next 2–3 trading days, AMD is expected to consolidate within a typical volatility band of $400.78 to $495.24. The probability of further upward movement is assessed at 25%, while a downside scenario holds a higher likelihood at 75%. Baseline expectations point toward sideways action within this corridor, though a bullish break above $458.36 could open room for additional gains. If bearish momentum takes hold, a move below the lower end of the range would likely lead to renewed selling pressure.
Earlier, analysts noted that AMD shares outperformed peers on the back of an upgrade and improved outlook despite broader market caution around semiconductor names. The current technical setup introduces a new consideration, as elevated volatility and conflicting momentum indicators suggest traders should monitor the $458.36 resistance level for signs of bullish continuation or increased downside risk.











-
 Afghanistan
-
 Albania
-
 Algeria
-
 Angola
-
 Argentina
-
 Armenia
-
 Australia
-
 Austria
-
 Azerbaijan
-
 Bahamas
-
 Bahrain
-
 Bangladesh
-
 Belarus
-
 Belgium
-
 Bolivia
-
 Botswana
-
 Brazil
-
 Brunei
-
 Bulgaria
-
 Cambodia
-
 Cameroon
-
 Canada
-
 Chile
-
 China
-
 Colombia
-
 Congo
-
 Costa Rica
-
 Cote d'Ivoire
-
 Croatia
-
 Cuba
-
 Cyprus
-
 Czechia
-
 DR Congo
-
 Denmark
-
 Dominican Republic
-
 Ecuador
-
 Egypt
-
 El Salvador
-
 Estonia
-
 Eswatini
-
 Ethiopia
-
 Finland
-
 France
-
 Georgia
-
 Germany
-
 Ghana
-
 Greece
-
 Haiti
-
 Hong Kong
-
 Hungary
-
 India
-
 Indonesia
-
 Iran, Islamic republic
-
 Iraq
-
 Ireland
-
 Israel
-
 Italy
-
 Jamaica
-
 Japan
-
 Jordan
-
 Kazakhstan
-
 Kenya
-
 Korea
-
 Kuwait
-
 Kyrgyzstan
-
 Laos
-
 Latvia
-
 Lebanon
-
 Lesotho
-
 Libya
-
 Lithuania
-
 Luxembourg
-
 Madagascar
-
 Malaysia
-
 Malta
-
 Mauritius
-
 Mexico
-
 Moldova
-
 Mongolia
-
 Montenegro
-
 Morocco
-
 Mozambique
-
 Myanmar
-
 Namibia
-
 Nepal
-
 Netherlands
-
 New Zealand
-
 Nigeria
-
 North Macedonia
-
 Norway
-
 Oman
-
 Pakistan
-
 Palestine
-
 Panama
-
 Papua New Guinea
-
 Paraguay
-
 Peru
-
 Philippines
-
 Poland
-
 Portugal
-
 Puerto Rico
-
 Qatar
-
 Reunion
-
 Romania
-
 Rwanda
-
 Saudi Arabia
-
 Serbia
-
 Singapore
-
 Slovakia
-
 Slovenia
-
 Somalia
-
 South Africa
-
 Spain
-
 Sri Lanka
-
 Sweden
-
 Switzerland
-
 Syria
-
 Taiwan
-
 Tajikistan
-
 Tanzania
-
 Thailand
-
 Trinidad and Tobago
-
 Tunisia
-
 Turkey
-
 UAE
-
 Uganda
-
 Ukraine
-
 United Kingdom
-
United States
-
 Uruguay
-
 Uzbekistan
-
 Venezuela
-
 Vietnam
-
 Yemen
-
 Zambia
-
 Zimbabwe
- Forex
- Crypto












