

Amazon posts Q3 2026 earnings with 39% AWS growth: Will AMZN extend gains?

Amazon (AMZN) stock is trading at $272.77, up 5.2% on the day. The price sits above its key moving averages, reflecting strong intraday momentum.
 264.15
271.46
Highlights
- Amazon AWS revenue grew 39% year over year in the third quarter of 2026, supporting the company’s recurring revenue position.
- Amazon increased its 2026 capital spending forecast to $220 billion from $200 billion to expand cloud infrastructure and address data center power constraints.
- Shares of Amazon recorded a 5.2% gain to $272.77, with technical indicators showing bullish momentum and an expected price range of $257.91 to $284.16 for the coming sessions.
Cloud growth and capex boost outlook amid ETF outflows
Amazon posted third quarter 2026 earnings highlighted by 39% year-over-year growth in its AWS division, demonstrating strong cloud demand and further reinforcing the company's recurring revenue position, according to Tipranks. The company also raised its 2026 capital spending guidance to $220 billion, up from $200 billion in the prior quarter, to expand cloud infrastructure and address operational bottlenecks related to data center power constraints, as reported by Fool and TradingKey. Meanwhile, data from Yahoo Finance indicated that U.S. ETFs registered a net outflow of $115.1 million in Amazon shares on November 5, 2026, as major funds including QQQ, SPY, and DIA led institutional repositioning, adding a note of short-term volatility despite the strong corporate performance.
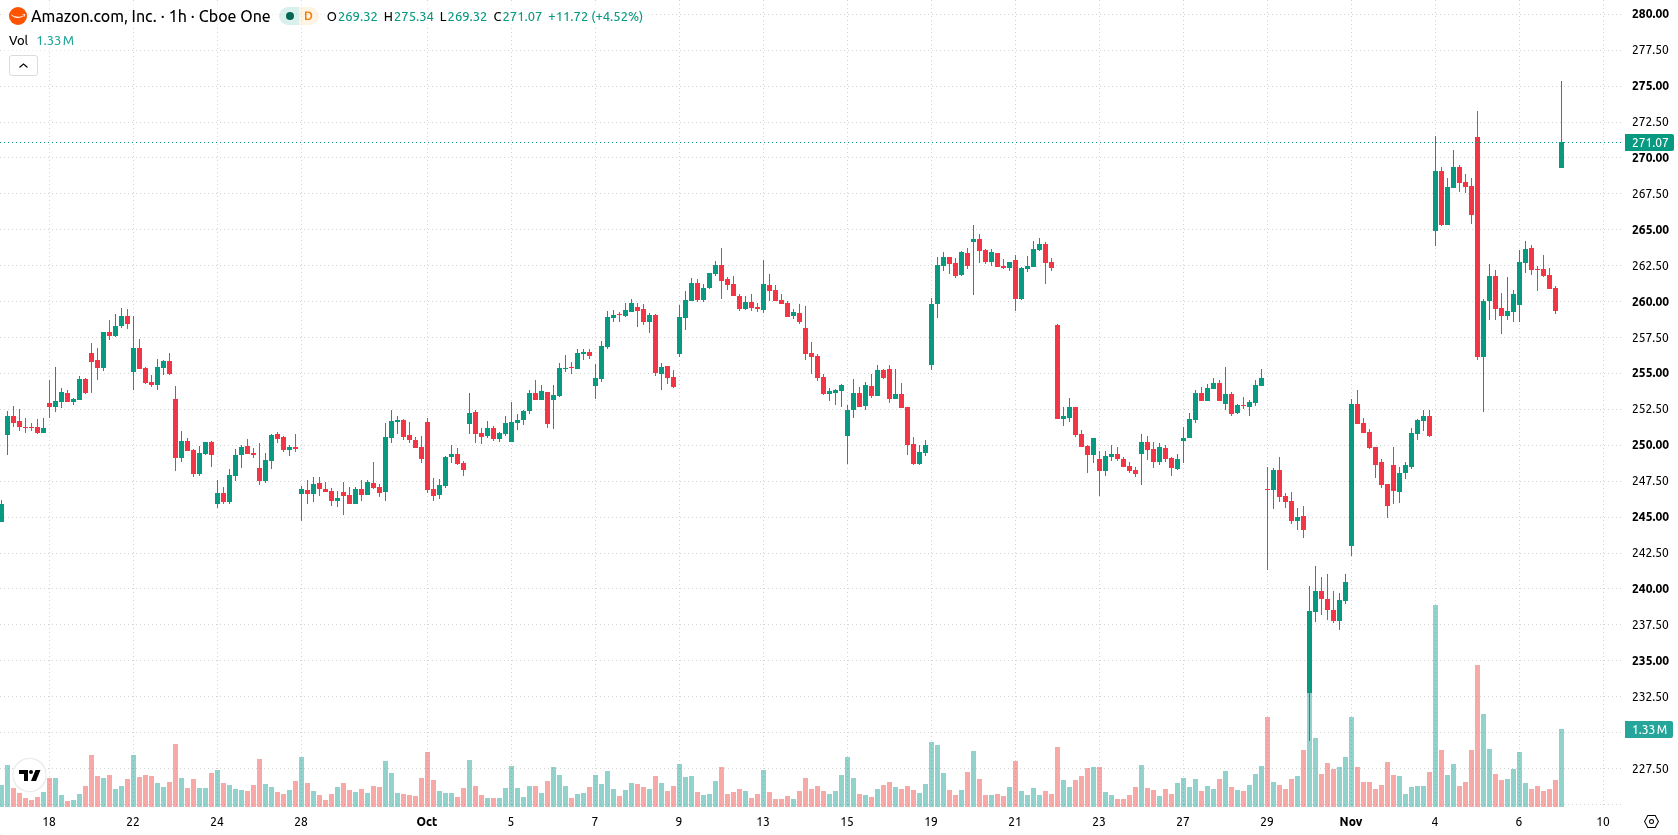
Bullish price holds above support as momentum signals consolidate
AMZN is currently trading above the MA-20 at $262.72 and MA-50 at $253.38 on the hourly timeframe, and remains well above the MA-200 at $243.93 on the daily chart. The Ichimoku Kijun sits at $260.44 providing immediate support, while projected support is also seen near this level. MACD confirms strong bullish momentum, ADX is neutral, and both RSI and CCI are neutral, signaling consolidation conditions. Stoch RSI has entered the oversold zone, suggesting a possible short-term technical rebound, while Bull/Bear Power is marginally negative intraday, indicating light seller dominance for the session.
Consolidation phase expected with modest upside probability
Looking ahead to the next several sessions, AMZN is expected to consolidate within the $257.91 to $284.16 range. There is a 57% probability of an upward move relative to current levels, with downside moves seen as less likely under prevailing conditions. The base case calls for continued trading inside this volatility band, while a move above $284.16 would point to renewed bullish momentum; alternatively, a drop below immediate support at $260.44 could trigger a deeper pullback.
Previously it was reported that Amazon expanded its AI-driven shopping capabilities while stepping up efforts to control third-party access to its marketplace. With Amazon’s latest earnings and capital expenditure guidance reinforcing its commitment to infrastructure and AI-driven growth, traders should monitor the $257.91 to $284.16 volatility band for potential breakouts or renewed consolidation.






Latest Amazon News





-
 Afghanistan
-
 Albania
-
 Algeria
-
 Angola
-
 Argentina
-
 Armenia
-
 Australia
-
 Austria
-
 Azerbaijan
-
 Bahamas
-
 Bahrain
-
 Bangladesh
-
 Belarus
-
 Belgium
-
 Bolivia
-
 Botswana
-
 Brazil
-
 Brunei
-
 Bulgaria
-
 Cambodia
-
 Cameroon
-
 Canada
-
 Chile
-
 China
-
 Colombia
-
 Congo
-
 Costa Rica
-
 Cote d'Ivoire
-
 Croatia
-
 Cuba
-
 Cyprus
-
 Czechia
-
 DR Congo
-
 Denmark
-
 Dominican Republic
-
 Ecuador
-
 Egypt
-
 El Salvador
-
 Estonia
-
 Eswatini
-
 Ethiopia
-
 Finland
-
 France
-
 Georgia
-
 Germany
-
 Ghana
-
 Greece
-
 Haiti
-
 Hong Kong
-
 Hungary
-
 India
-
 Indonesia
-
 Iran, Islamic republic
-
 Iraq
-
 Ireland
-
 Israel
-
 Italy
-
 Jamaica
-
 Japan
-
 Jordan
-
 Kazakhstan
-
 Kenya
-
 Korea
-
 Kuwait
-
 Kyrgyzstan
-
 Laos
-
 Latvia
-
 Lebanon
-
 Lesotho
-
 Libya
-
 Lithuania
-
 Luxembourg
-
 Madagascar
-
 Malaysia
-
 Malta
-
 Mauritius
-
 Mexico
-
 Moldova
-
 Mongolia
-
 Montenegro
-
 Morocco
-
 Mozambique
-
 Myanmar
-
 Namibia
-
 Nepal
-
 Netherlands
-
 New Zealand
-
 Nigeria
-
 North Macedonia
-
 Norway
-
 Oman
-
 Pakistan
-
 Palestine
-
 Panama
-
 Papua New Guinea
-
 Paraguay
-
 Peru
-
 Philippines
-
 Poland
-
 Portugal
-
 Puerto Rico
-
 Qatar
-
 Reunion
-
 Romania
-
 Rwanda
-
 Saudi Arabia
-
 Serbia
-
 Singapore
-
 Slovakia
-
 Slovenia
-
 Somalia
-
 South Africa
-
 Spain
-
 Sri Lanka
-
 Sweden
-
 Switzerland
-
 Syria
-
 Taiwan
-
 Tajikistan
-
 Tanzania
-
 Thailand
-
 Trinidad and Tobago
-
 Tunisia
-
 Turkey
-
 UAE
-
 Uganda
-
 Ukraine
-
 United Kingdom
-
United States
-
 Uruguay
-
 Uzbekistan
-
 Venezuela
-
 Vietnam
-
 Yemen
-
 Zambia
-
 Zimbabwe
- Forex
- Crypto












