

Why is Constellation Energy stock up 5.7% today?

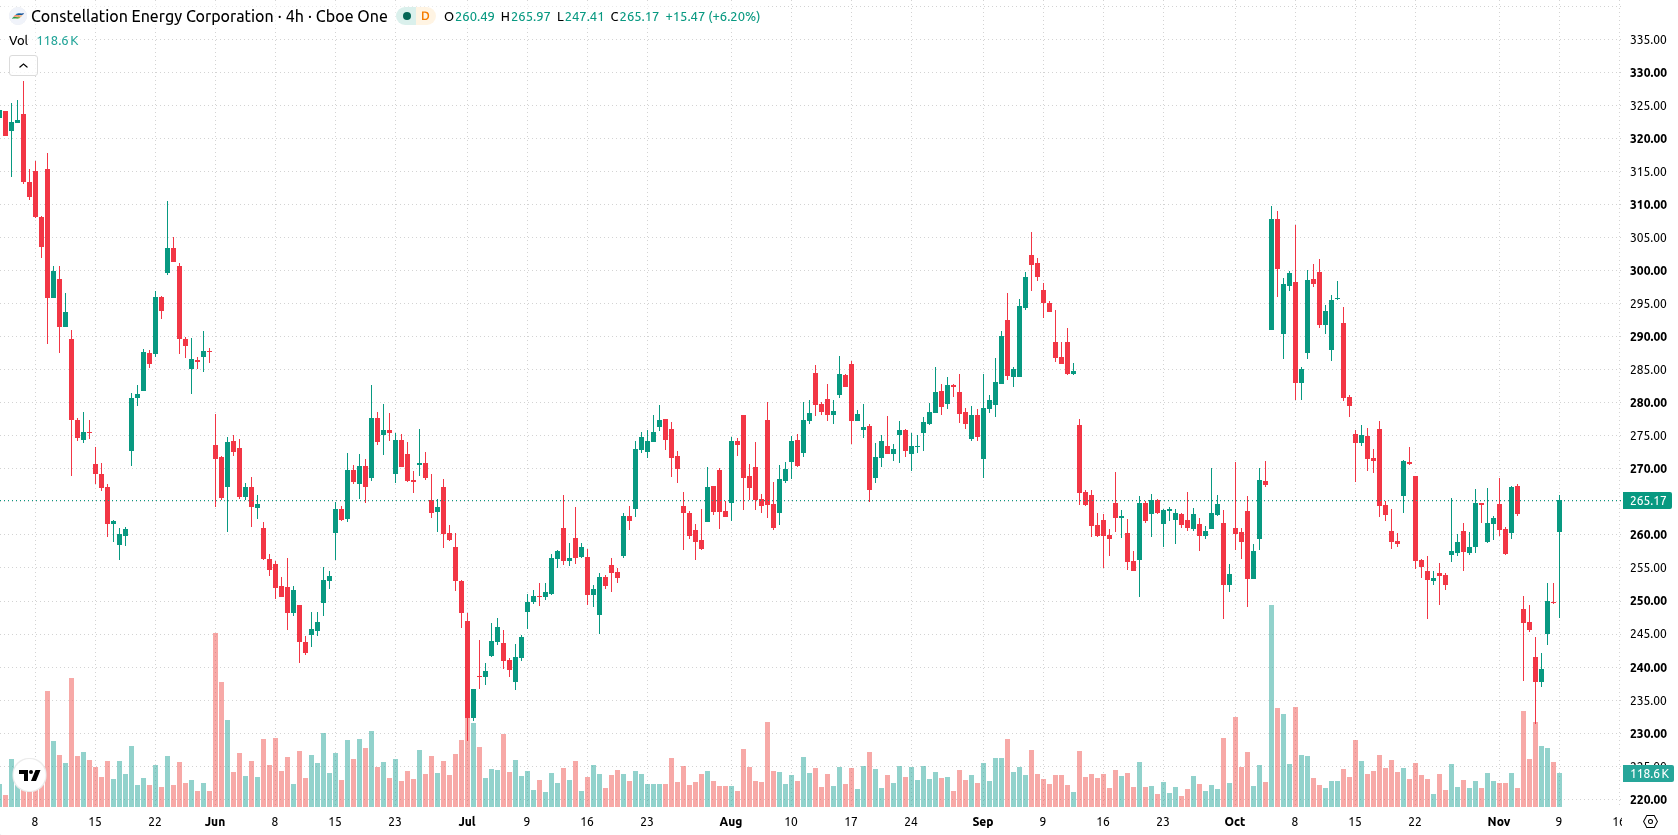
Constellation Energy Corporation (CEG) surged 5.74% after reporting strong third-quarter financial results and lifting its annual earnings guidance. The rebound looks limited, as CEG remains below its 50- and 200-day moving averages with persistent bearish signals from longer-term trend and resistance levels.
 277.66
Highlights
- Constellation Energy stock saw adjusted operating earnings rise 66% year over year to $5.06 per share, beating expectations.
- Revenue reached $9.55 billion influenced by organic growth and the Calpine acquisition, with the company raising its full-year 2026 earnings outlook.
- Shares are trading in a sideways range of $246.07 to $282.1, with technical indicators signaling dominant bearish momentum and resistance near $267.55.
Upbeat earnings and buybacks drive guidance upgrade and sentiment shift
Constellation Energy reported adjusted operating earnings of $5.06 per share for the third quarter of 2026, a 66% increase over the previous year and ahead of analyst expectations. Revenue reached $9.55 billion, reflecting organic growth and contributions from the Calpine acquisition completed in January 2026. The company raised its full-year 2026 earnings guidance and highlighted recent stock buybacks and long-term nuclear contracts, including a 20-year agreement with Google.
Near-term support challenged as bearish momentum dominates indicators
Constellation Energy is trading above its 20-day moving average at $263.43, but remains below the 50-day ($270.01) and 200-day ($278.69) moving averages. This suggests a short-term recovery, yet medium- and long-term trends are still under pressure, with $267.55 as near-term ceiling and $263.43 as near-term floor. The Ichimoku Kijun at $270.5 continues to act as overhead resistance, while the alignment of the 50-day versus 200-day moving averages signals a bearish long-term outlook. Momentum indicators remain bearish. The MACD is negative and confirms downside momentum. The ADX is neutral, indicating limited trend strength. All three oscillators—RSI, Stochastic RSI, and CCI—are in neutral zones. Bull/Bear Power is negative, reflecting intraday dominance by sellers. The Awesome Oscillator is also bearish. Intraday volatility is elevated with strong movement toward the session high, but overall momentum signals remain conflicted and sellers retain control.
Previously it was reported that Constellation Energy faced persistent technical resistance and a lack of trend strength despite increased trading activity. The latest results reinforce these challenges, with ongoing bearish signals and downward momentum suggesting traders should closely monitor potential downside risk if the price falls below $263.43.






Latest Constellation Energy News


-
 Afghanistan
-
 Albania
-
 Algeria
-
 Angola
-
 Argentina
-
 Armenia
-
 Australia
-
 Austria
-
 Azerbaijan
-
 Bahamas
-
 Bahrain
-
 Bangladesh
-
 Belarus
-
 Belgium
-
 Bolivia
-
 Botswana
-
 Brazil
-
 Brunei
-
 Bulgaria
-
 Cambodia
-
 Cameroon
-
 Canada
-
 Chile
-
 China
-
 Colombia
-
 Congo
-
 Costa Rica
-
 Cote d'Ivoire
-
 Croatia
-
 Cuba
-
 Cyprus
-
 Czechia
-
 DR Congo
-
 Denmark
-
 Dominican Republic
-
 Ecuador
-
 Egypt
-
 El Salvador
-
 Estonia
-
 Eswatini
-
 Ethiopia
-
 Finland
-
 France
-
 Georgia
-
 Germany
-
 Ghana
-
 Greece
-
 Haiti
-
 Hong Kong
-
 Hungary
-
 India
-
 Indonesia
-
 Iran, Islamic republic
-
 Iraq
-
 Ireland
-
 Israel
-
 Italy
-
 Jamaica
-
 Japan
-
 Jordan
-
 Kazakhstan
-
 Kenya
-
 Korea
-
 Kuwait
-
 Kyrgyzstan
-
 Laos
-
 Latvia
-
 Lebanon
-
 Lesotho
-
 Libya
-
 Lithuania
-
 Luxembourg
-
 Madagascar
-
 Malaysia
-
 Malta
-
 Mauritius
-
 Mexico
-
 Moldova
-
 Mongolia
-
 Montenegro
-
 Morocco
-
 Mozambique
-
 Myanmar
-
 Namibia
-
 Nepal
-
 Netherlands
-
 New Zealand
-
 Nigeria
-
 North Macedonia
-
 Norway
-
 Oman
-
 Pakistan
-
 Palestine
-
 Panama
-
 Papua New Guinea
-
 Paraguay
-
 Peru
-
 Philippines
-
 Poland
-
 Portugal
-
 Puerto Rico
-
 Qatar
-
 Reunion
-
 Romania
-
 Rwanda
-
 Saudi Arabia
-
 Serbia
-
 Singapore
-
 Slovakia
-
 Slovenia
-
 Somalia
-
 South Africa
-
 Spain
-
 Sri Lanka
-
 Sweden
-
 Switzerland
-
 Syria
-
 Taiwan
-
 Tajikistan
-
 Tanzania
-
 Thailand
-
 Trinidad and Tobago
-
 Tunisia
-
 Turkey
-
 UAE
-
 Uganda
-
 Ukraine
-
 United Kingdom
-
United States
-
 Uruguay
-
 Uzbekistan
-
 Venezuela
-
 Vietnam
-
 Yemen
-
 Zambia
-
 Zimbabwe
- Forex
- Crypto












