

CEG climbs over 3% after pre-earnings rally and mixed technical signals

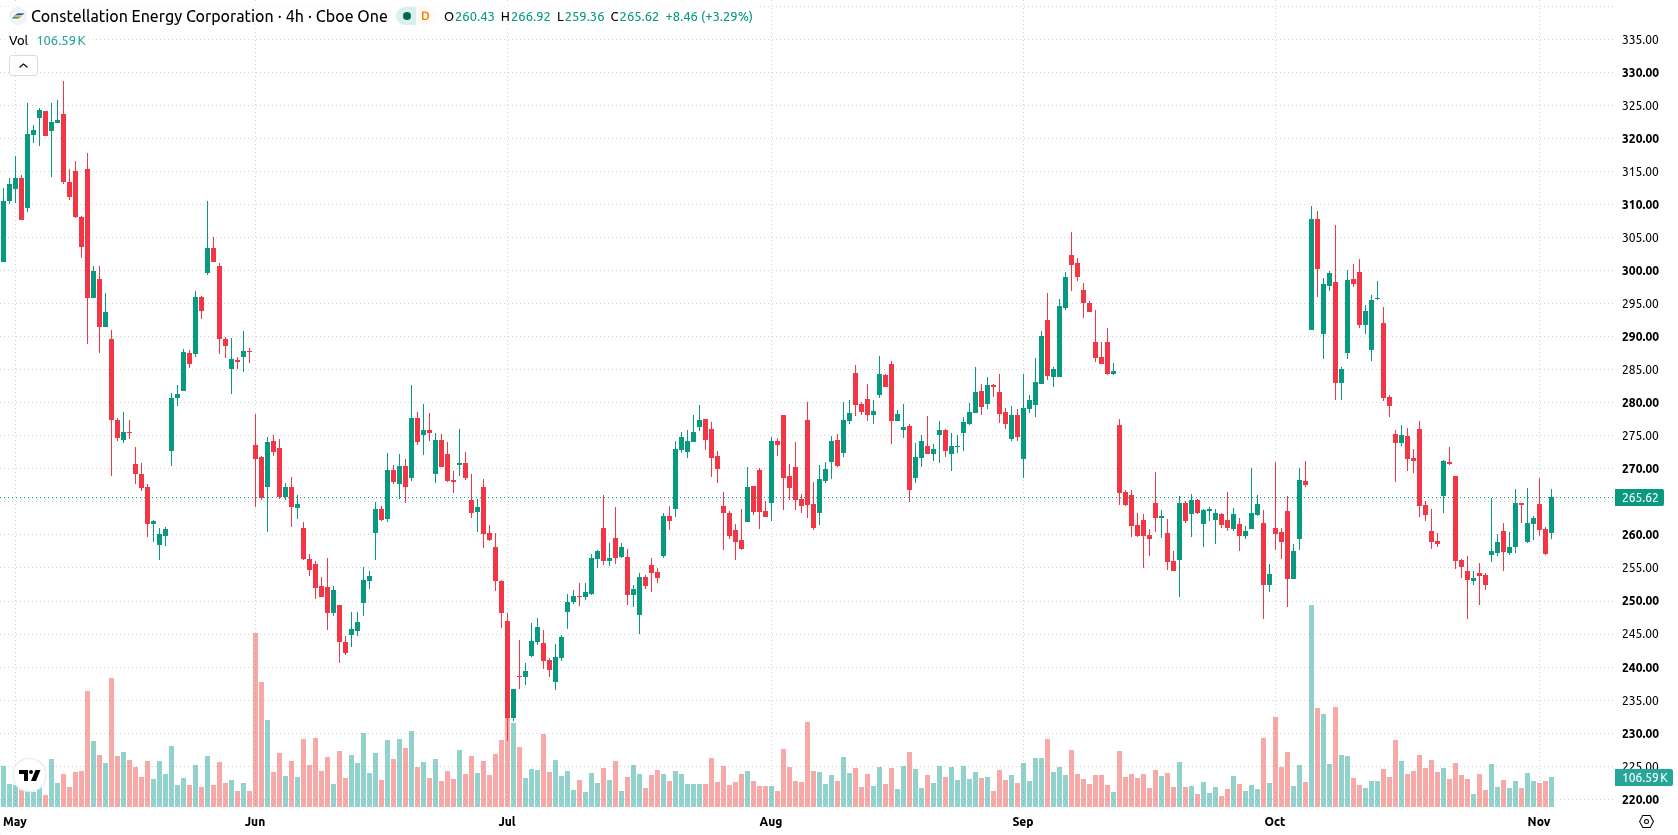
Constellation Energy Corporation (CEG) climbed 3.26% as investors position ahead of its upcoming third quarter earnings report, with anticipation of year-over-year growth in both revenue and earnings driving demand. The move looks limited, with Constellation Energy still trading below its 20-day, 50-day, and 200-day moving averages, highlighting persistent technical resistance.
 252.67
268.48
Highlights
- Constellation Energy is expected to report third quarter 2026 revenue of $9.23 billion and earnings per share of $3.88.
- Analysts forecast year-over-year improvement in both revenue and earnings for the period ended September 2026.
- Shares of Constellation Energy trade below key moving averages, with technical signals indicating a high probability of near-term downside and an expected five-day range of $248.40 to $272.65.
Earnings optimism shapes market expectations before quarterly release
Constellation Energy is set to report its third quarter 2026 earnings on November 9 before the market opens. Market forecasts expect the company to show year-over-year improvement in both revenue and earnings for the quarter ended September 2026. The consensus estimates point to revenues of $9.23 billion USD and earnings per share of $3.88 USD.
Mixed technical signals as intraday strength contrasts broader resistance
Constellation Energy remains under pressure on all major timeframes, with the price still below its 20-day, 50-day, and 200-day moving averages at $272.69, $272.35, and $279.63, respectively. The nearest notable resistance is observed at $268.64 and support at $256.86. Technical signals are mixed: the MACD indicates a bearish bias, while the Average Directional Index (ADX) is neutral, reflecting the absence of a clear trend. Oscillators including the Relative Strength Index (RSI), Stochastic RSI, and Commodity Channel Index (CCI) are all in neutral zones, not indicating overbought or oversold conditions. Bull/Bear Power (BBP) is positive at 5.42, suggesting buyers have intraday momentum advantage. The session so far has shown strong upward movement, with the price near its session high and intraday volatility at 4.59%. Despite this, there is visible divergence between intraday strength and weaker mid-term momentum.
Previously it was reported that Constellation Energy faced persistent technical resistance despite increased institutional and quantitative trading activity. The current analysis extends this view by highlighting that ongoing lack of trend strength and downside risk remain dominant, with traders advised to watch for reactions at the $268.64 resistance and $256.86 support as earnings approach.






Latest Constellation Energy News



-
 Afghanistan
-
 Albania
-
 Algeria
-
 Angola
-
 Argentina
-
 Armenia
-
 Australia
-
 Austria
-
 Azerbaijan
-
 Bahamas
-
 Bahrain
-
 Bangladesh
-
 Belarus
-
 Belgium
-
 Bolivia
-
 Botswana
-
 Brazil
-
 Brunei
-
 Bulgaria
-
 Cambodia
-
 Cameroon
-
 Canada
-
 Chile
-
 China
-
 Colombia
-
 Congo
-
 Costa Rica
-
 Cote d'Ivoire
-
 Croatia
-
 Cuba
-
 Cyprus
-
 Czechia
-
 DR Congo
-
 Denmark
-
 Dominican Republic
-
 Ecuador
-
 Egypt
-
 El Salvador
-
 Estonia
-
 Eswatini
-
 Ethiopia
-
 Finland
-
 France
-
 Georgia
-
 Germany
-
 Ghana
-
 Greece
-
 Haiti
-
 Hong Kong
-
 Hungary
-
 India
-
 Indonesia
-
 Iran, Islamic republic
-
 Iraq
-
 Ireland
-
 Israel
-
 Italy
-
 Jamaica
-
 Japan
-
 Jordan
-
 Kazakhstan
-
 Kenya
-
 Korea
-
 Kuwait
-
 Kyrgyzstan
-
 Laos
-
 Latvia
-
 Lebanon
-
 Lesotho
-
 Libya
-
 Lithuania
-
 Luxembourg
-
 Madagascar
-
 Malaysia
-
 Malta
-
 Mauritius
-
 Mexico
-
 Moldova
-
 Mongolia
-
 Montenegro
-
 Morocco
-
 Mozambique
-
 Myanmar
-
 Namibia
-
 Nepal
-
 Netherlands
-
 New Zealand
-
 Nigeria
-
 North Macedonia
-
 Norway
-
 Oman
-
 Pakistan
-
 Palestine
-
 Panama
-
 Papua New Guinea
-
 Paraguay
-
 Peru
-
 Philippines
-
 Poland
-
 Portugal
-
 Puerto Rico
-
 Qatar
-
 Reunion
-
 Romania
-
 Rwanda
-
 Saudi Arabia
-
 Serbia
-
 Singapore
-
 Slovakia
-
 Slovenia
-
 Somalia
-
 South Africa
-
 Spain
-
 Sri Lanka
-
 Sweden
-
 Switzerland
-
 Syria
-
 Taiwan
-
 Tajikistan
-
 Tanzania
-
 Thailand
-
 Trinidad and Tobago
-
 Tunisia
-
 Turkey
-
 UAE
-
 Uganda
-
 Ukraine
-
 United Kingdom
-
United States
-
 Uruguay
-
 Uzbekistan
-
 Venezuela
-
 Vietnam
-
 Yemen
-
 Zambia
-
 Zimbabwe
- Forex
- Crypto












