

What's behind TE Connectivity's latest 5.7% stock surge?

TE Connectivity Ltd (TEL) surged 5.73% as strong buying momentum and a bullish technical setup propelled the stock higher. The move is supported by the price holding above all key moving averages and pushing toward its intraday highs.
 220.73
222.40
Highlights
- Shares of TE Connectivity are trading above all key moving averages, indicating sustained strength across multiple time frames.
- Momentum indicators are mixed overall, with some pointing to neutral momentum and others in oversold territory suggesting potential for a rebound.
- The expected price range for the next five sessions is $210.32 to $227.48, with a 68% probability of a downward move.
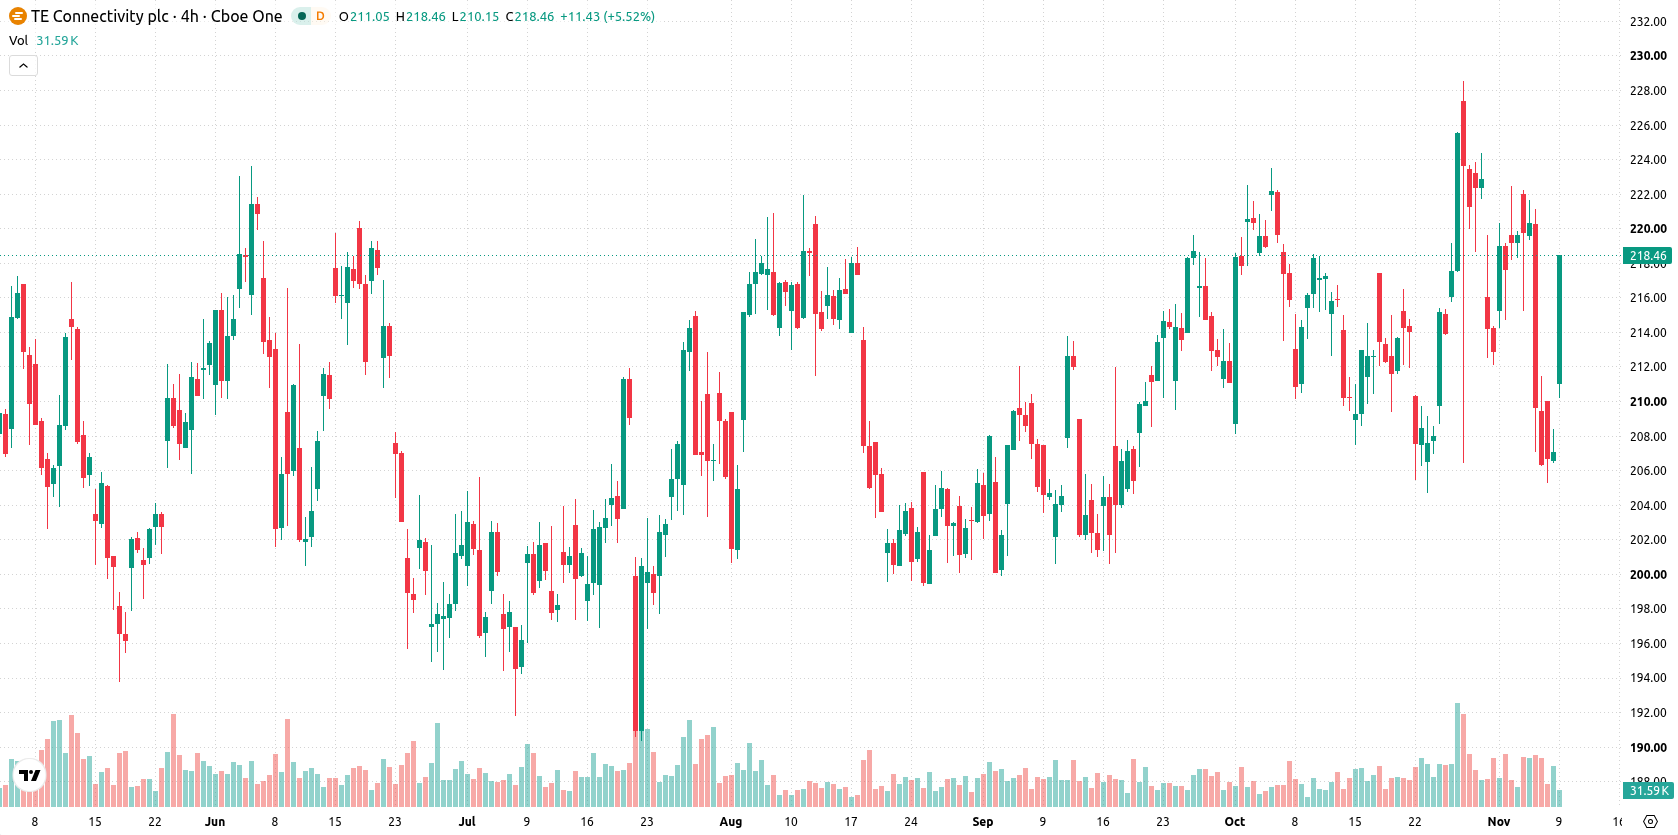
Technical strength meets mixed momentum as oversold signals emerge
TE Connectivity is trading above all key moving averages, with $218.90 above the MA-20 at $214.65, MA-50 at $212.17, and MA-200 at $212.27. This alignment signals continued strength in short-, medium-, and long-term trends, with the near-term ceiling at $222.40 and support at $217.44. Momentum indicators show mixed signals, as the MACD and Average Directional Index (ADX) are neutral, and the Relative Strength Index (RSI) is also neutral. The Stochastic RSI and Commodity Channel Index (CCI) are in oversold zones, suggesting potential for a rebound. Bull/Bear Power (BBP) is negative at -4.48, showing intraday seller dominance, while the Awesome Oscillator is neutral. The price rallied sharply from the previous close, gaining $11.86 or 5.73% on an upside gap of 1.88%, and is near the session high with intraday volatility at 2.42%.
Earlier, analysts noted that TE Connectivity was under sustained downward pressure amid a bearish technical setup and mixed momentum signals. The current surge above key moving averages marks a potential shift toward bullish control, making a close watch on the $222.40 resistance crucial for determining whether the rally can be sustained or if a pullback is likely.






Latest TE Connectivity Ltd News




-
 Afghanistan
-
 Albania
-
 Algeria
-
 Angola
-
 Argentina
-
 Armenia
-
 Australia
-
 Austria
-
 Azerbaijan
-
 Bahamas
-
 Bahrain
-
 Bangladesh
-
 Belarus
-
 Belgium
-
 Bolivia
-
 Botswana
-
 Brazil
-
 Brunei
-
 Bulgaria
-
 Cambodia
-
 Cameroon
-
 Canada
-
 Chile
-
 China
-
 Colombia
-
 Congo
-
 Costa Rica
-
 Cote d'Ivoire
-
 Croatia
-
 Cuba
-
 Cyprus
-
 Czechia
-
 DR Congo
-
 Denmark
-
 Dominican Republic
-
 Ecuador
-
 Egypt
-
 El Salvador
-
 Estonia
-
 Eswatini
-
 Ethiopia
-
 Finland
-
 France
-
 Georgia
-
 Germany
-
 Ghana
-
 Greece
-
 Haiti
-
 Hong Kong
-
 Hungary
-
 India
-
 Indonesia
-
 Iran, Islamic republic
-
 Iraq
-
 Ireland
-
 Israel
-
 Italy
-
 Jamaica
-
 Japan
-
 Jordan
-
 Kazakhstan
-
 Kenya
-
 Korea
-
 Kuwait
-
 Kyrgyzstan
-
 Laos
-
 Latvia
-
 Lebanon
-
 Lesotho
-
 Libya
-
 Lithuania
-
 Luxembourg
-
 Madagascar
-
 Malaysia
-
 Malta
-
 Mauritius
-
 Mexico
-
 Moldova
-
 Mongolia
-
 Montenegro
-
 Morocco
-
 Mozambique
-
 Myanmar
-
 Namibia
-
 Nepal
-
 Netherlands
-
 New Zealand
-
 Nigeria
-
 North Macedonia
-
 Norway
-
 Oman
-
 Pakistan
-
 Palestine
-
 Panama
-
 Papua New Guinea
-
 Paraguay
-
 Peru
-
 Philippines
-
 Poland
-
 Portugal
-
 Puerto Rico
-
 Qatar
-
 Reunion
-
 Romania
-
 Rwanda
-
 Saudi Arabia
-
 Serbia
-
 Singapore
-
 Slovakia
-
 Slovenia
-
 Somalia
-
 South Africa
-
 Spain
-
 Sri Lanka
-
 Sweden
-
 Switzerland
-
 Syria
-
 Taiwan
-
 Tajikistan
-
 Tanzania
-
 Thailand
-
 Trinidad and Tobago
-
 Tunisia
-
 Turkey
-
 UAE
-
 Uganda
-
 Ukraine
-
 United Kingdom
-
United States
-
 Uruguay
-
 Uzbekistan
-
 Venezuela
-
 Vietnam
-
 Yemen
-
 Zambia
-
 Zimbabwe
- Forex
- Crypto












