The tweet was deleted by the author.
But we saved everything 🙂.


Alphabet Inc. (GOOGL, formerly Google) is trading at $289.83, reflecting a strong rebound versus the prior close, as the price opened at $284.78 and quickly advanced to an intraday high of $288.76 — a gain of $5.05 or 1.8% from yesterday. The session has seen moderate volatility with persistent buying interest after a morning gap up. Today's rise is attributed to renewed demand from institutional traders following enthusiastically received AI hardware announcements, with further support from positive sentiment driven by Sundar Pichai's recent comments about innovation velocity.
 304.22
Sundar Pichai highlighted Google's rapid hardware innovation, noting the deployment of four distinct TPU systems within a single generation this year. This matters because it positions GOOGL to accelerate AI product adoption and strengthen its competitive position in cloud and enterprise markets, likely supporting long-term revenue growth and customer demand. The market has confirmed this fundamental signal with increased trading activity and positive price action, further bolstered by Alphabet's unveiling of next-generation TPU chips designed for regulated industries and expanding AI workloads. Other recent developments include the company's 25% year-over-year revenue growth, a new quarterly dividend, and ETF net selling activity.
View post on X Loading...
GOOGL is trading well below its MA-20 at $317.47, MA-50 at $333.02, and MA-200 at $339.51, confirming persistent longer-term selling pressure. The Ichimoku Kijun at $318.05 acts as the closest major resistance, with nearest intraday support around $282.00. Momentum indicators remain negative, except for some short-term divergence, as persistent buying pressure at session highs meets dominant oversold conditions and weak trend signals. For the next five sessions, the price is expected to range between $282.00 and $296.00; the supportive tweet from Pichai further aligns with the technical bias for a stabilization attempt if resistance levels are challenged.
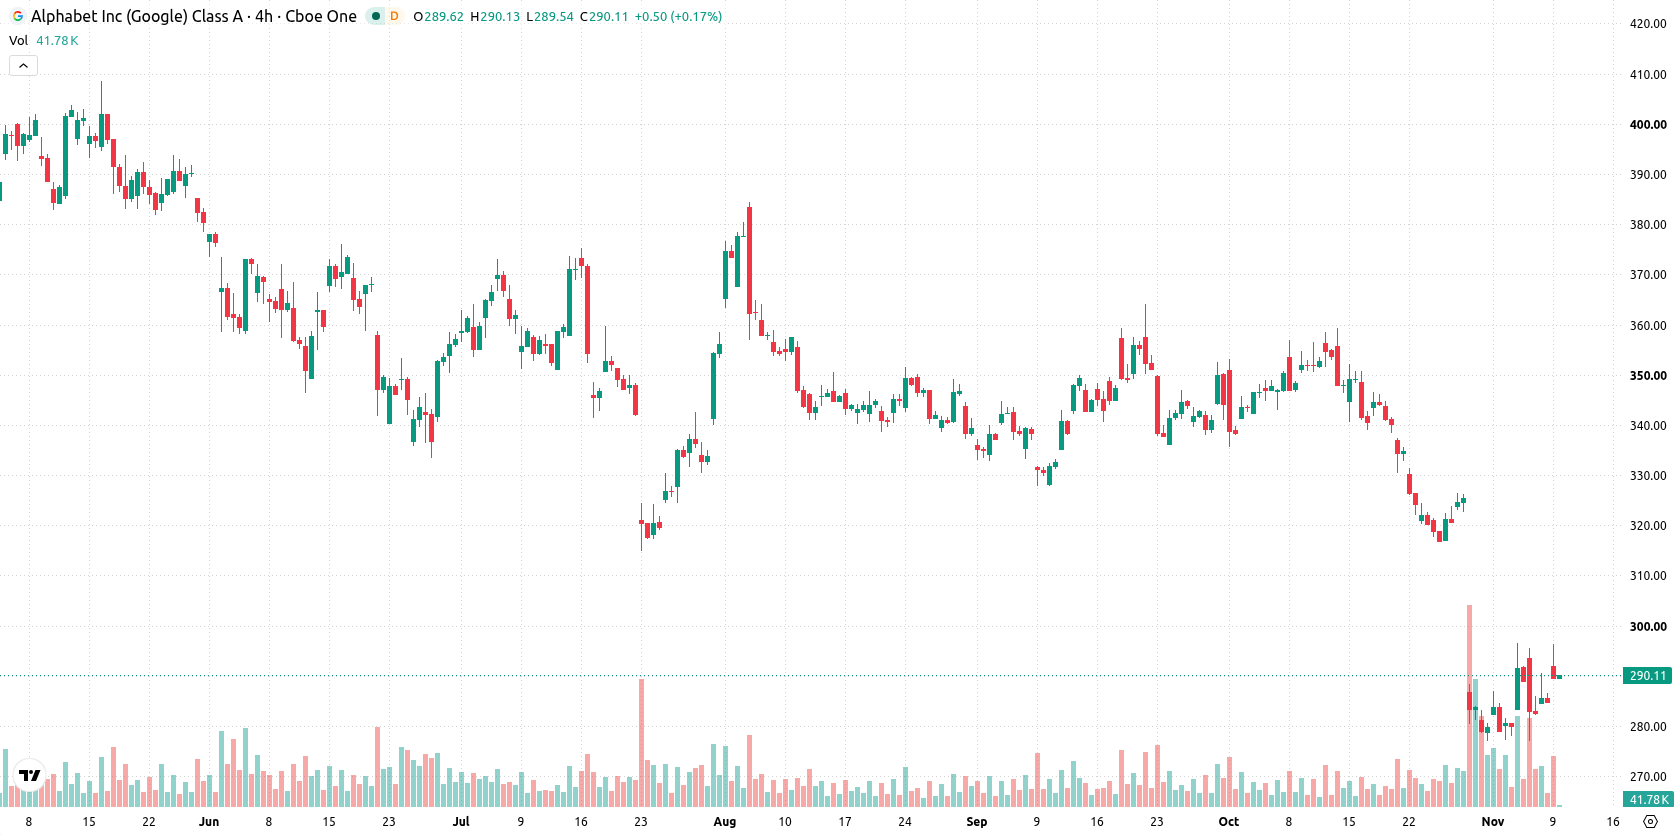
Previously, analysts noted that Alphabet stock was facing ongoing technical pressure despite attempts to recover and potential diversification efforts in Asian bond markets. The current article builds on this by highlighting a shift in price momentum, with traders now advised to monitor whether the prevailing trend sustains or if a breakout above key resistance signals a new direction.



 Afghanistan
 Albania
 Algeria
 Angola
 Argentina
 Armenia
 Australia
 Austria
 Azerbaijan
 Bahamas
 Bahrain
 Bangladesh
 Belarus
 Belgium
 Bolivia
 Botswana
 Brazil
 Brunei
 Bulgaria
 Cambodia
 Cameroon
 Canada
 Chile
 China
 Colombia
 Congo
 Costa Rica
 Cote d'Ivoire
 Croatia
 Cuba
 Cyprus
 Czechia
 DR Congo
 Denmark
 Dominican Republic
 Ecuador
 Egypt
 El Salvador
 Estonia
 Eswatini
 Ethiopia
 Finland
 France
 Georgia
 Germany
 Ghana
 Greece
 Haiti
 Hong Kong
 Hungary
 India
 Indonesia
 Iran, Islamic republic
 Iraq
 Ireland
 Israel
 Italy
 Jamaica
 Japan
 Jordan
 Kazakhstan
 Kenya
 Korea
 Kuwait
 Kyrgyzstan
 Laos
 Latvia
 Lebanon
 Lesotho
 Libya
 Lithuania
 Luxembourg
 Madagascar
 Malaysia
 Malta
 Mauritius
 Mexico
 Moldova
 Mongolia
 Montenegro
 Morocco
 Mozambique
 Myanmar
 Namibia
 Nepal
 Netherlands
 New Zealand
 Nigeria
 North Macedonia
 Norway
 Oman
 Pakistan
 Palestine
 Panama
 Papua New Guinea
 Paraguay
 Peru
 Philippines
 Poland
 Portugal
 Puerto Rico
 Qatar
 Reunion
 Romania
 Rwanda
 Saudi Arabia
 Serbia
 Singapore
 Slovakia
 Slovenia
 Somalia
 South Africa
 Spain
 Sri Lanka
 Sweden
 Switzerland
 Syria
 Taiwan
 Tajikistan
 Tanzania
 Thailand
 Trinidad and Tobago
 Tunisia
 Turkey
 UAE
 Uganda
 Ukraine
 United Kingdom
United States
 Uruguay
 Uzbekistan
 Venezuela
 Vietnam
 Yemen
 Zambia
 Zimbabwe