

Quantum Computing stock gains as buyer support fuels upward price move

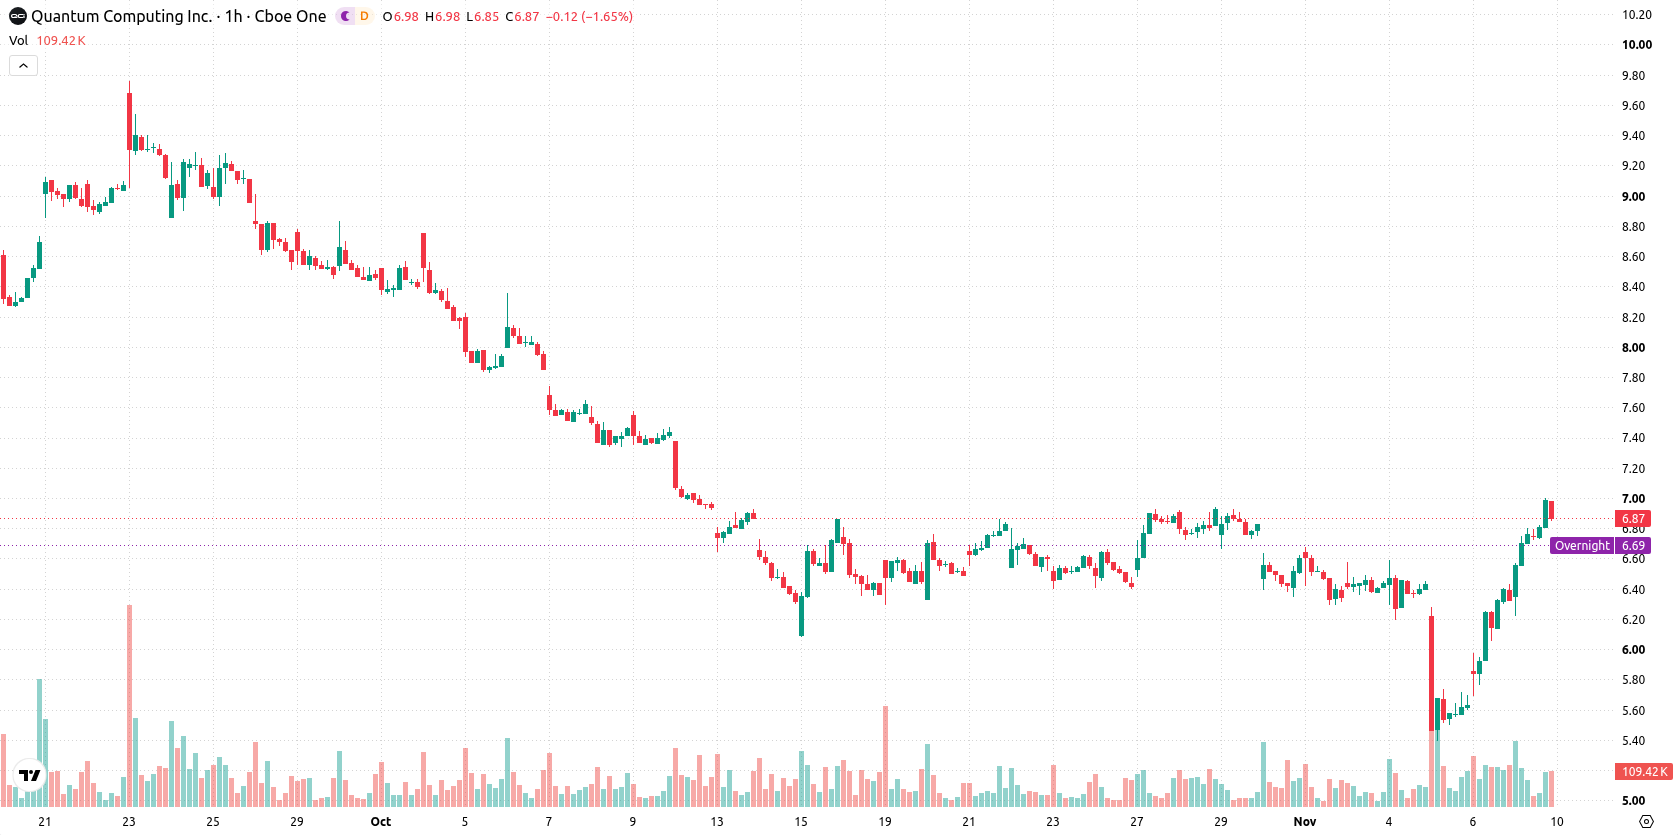
Quantum Computing (QUBT) stock is trading at $6.86, up 8.37% on the day, and sits above its key moving averages in the short and medium term. The stock is trading near the session high, reflecting renewed bullish momentum relative to recent trends.
 5.81
6.99
Highlights
- Quantum Computing Inc. posted record Q3 2026 revenue of $9.5 million, supported by growth in its photonics business and acquisitions.
- The company held $1.3 billion in cash, cash equivalents, and investments at quarter end with a net loss of $15.1 million.
- Shares of Quantum Computing Inc. gained 8.37% to $6.86 with strong short- and medium-term bullish momentum; the price is expected to range between $6.15 and $7.57.
Record revenue and acquisitions drive positive outlook amid net loss
Quantum Computing Inc. delivered a substantial operational milestone this quarter, reporting record Q3 2026 revenue of $9.5 million, a surge driven by the expansion of its photonics business and recent acquisitions, according to Gurufocus. This growth reflects aggressive scaling and has helped underpin a positive outlook for the company, further reinforced by the achievement of its 2024-2026 roadmap objectives and the planned shipment of its first Direct3S quantum optimization machine. The company also ended the quarter with $1.3 billion in cash, cash equivalents, and investments, based on Seeking Alpha, providing significant liquidity for ongoing operations despite booking a net loss of $15.1 million for the period.
Overbought signals and strong momentum heighten short-term volatility risk
QUBT is trading above its MA-20 and MA-50 on the hourly chart, while remaining below the MA-200 on the daily timeframe. The Ichimoku Kijun level at $6.2 serves as a nearby support. Momentum readings are strong, with both MACD and ADX giving buy signals, while Stochastic RSI and CCI are firmly in overbought territory, indicating increased risk of a short-term pullback. Bull/Bear Power stands at 0.4, supporting continued intraday buying, and the Awesome Oscillator reflects this ongoing positive momentum, though divergence between overbought oscillators and persistent upside highlights potential volatility.
Upside breakout likely as momentum reinforces intraday volatility band
In the short term, QUBT is expected to trade within a volatility band between $6.15 and $7.57. A further breakout above the upper end of this range would signal potential for additional gains, with a 72% probability favoring this scenario. Should the price drop below immediate support at $6.2, a swift pullback could follow, but this remains the less likely outcome given current momentum signals.
Earlier, analysts noted that Quantum Computing Inc. was at a technical crossroads, with price action shaped by earnings anticipation, recent acquisitions, and mixed momentum indicators. The latest operational and revenue milestones, reinforced by strong short-term momentum, add conviction to the prevailing bullish scenario, with traders advised to monitor the $6.15–$7.57 range for signs of sustained direction or volatility-driven reversals.






Latest Quantum Computing News




-
 Afghanistan
-
 Albania
-
 Algeria
-
 Angola
-
 Argentina
-
 Armenia
-
 Australia
-
 Austria
-
 Azerbaijan
-
 Bahamas
-
 Bahrain
-
 Bangladesh
-
 Belarus
-
 Belgium
-
 Bolivia
-
 Botswana
-
 Brazil
-
 Brunei
-
 Bulgaria
-
 Cambodia
-
 Cameroon
-
 Canada
-
 Chile
-
 China
-
 Colombia
-
 Congo
-
 Costa Rica
-
 Cote d'Ivoire
-
 Croatia
-
 Cuba
-
 Cyprus
-
 Czechia
-
 DR Congo
-
 Denmark
-
 Dominican Republic
-
 Ecuador
-
 Egypt
-
 El Salvador
-
 Estonia
-
 Eswatini
-
 Ethiopia
-
 Finland
-
 France
-
 Georgia
-
 Germany
-
 Ghana
-
 Greece
-
 Haiti
-
 Hong Kong
-
 Hungary
-
 India
-
 Indonesia
-
 Iran, Islamic republic
-
 Iraq
-
 Ireland
-
 Israel
-
 Italy
-
 Jamaica
-
 Japan
-
 Jordan
-
 Kazakhstan
-
 Kenya
-
 Korea
-
 Kuwait
-
 Kyrgyzstan
-
 Laos
-
 Latvia
-
 Lebanon
-
 Lesotho
-
 Libya
-
 Lithuania
-
 Luxembourg
-
 Madagascar
-
 Malaysia
-
 Malta
-
 Mauritius
-
 Mexico
-
 Moldova
-
 Mongolia
-
 Montenegro
-
 Morocco
-
 Mozambique
-
 Myanmar
-
 Namibia
-
 Nepal
-
 Netherlands
-
 New Zealand
-
 Nigeria
-
 North Macedonia
-
 Norway
-
 Oman
-
 Pakistan
-
 Palestine
-
 Panama
-
 Papua New Guinea
-
 Paraguay
-
 Peru
-
 Philippines
-
 Poland
-
 Portugal
-
 Puerto Rico
-
 Qatar
-
 Reunion
-
 Romania
-
 Rwanda
-
 Saudi Arabia
-
 Serbia
-
 Singapore
-
 Slovakia
-
 Slovenia
-
 Somalia
-
 South Africa
-
 Spain
-
 Sri Lanka
-
 Sweden
-
 Switzerland
-
 Syria
-
 Taiwan
-
 Tajikistan
-
 Tanzania
-
 Thailand
-
 Trinidad and Tobago
-
 Tunisia
-
 Turkey
-
 UAE
-
 Uganda
-
 Ukraine
-
 United Kingdom
-
United States
-
 Uruguay
-
 Uzbekistan
-
 Venezuela
-
 Vietnam
-
 Yemen
-
 Zambia
-
 Zimbabwe
- Forex
- Crypto












