

Visa shares weekly forecast: Faces resistance at $437.61 amid mixed momentum signals

Shares of Visa Inc. (V) are trading near $421 as the stock manages to hold above key moving averages. After a steady week with minor movement, attention turns to corporate actions and earnings momentum for the days ahead.
 425.24
437.61
Highlights
- Shares of Visa closed at $421.01, ending the week at the bottom of the recent range but holding above key moving averages.
- The daily trend structure remains bullish long term, but momentum and oscillator signals are mixed with signs of possible overheating.
- Key technical levels are support at $417.69 and resistance at $437.61, with next week’s likely trading range projected at $412.1 to $442.84.
Dividend hike and BioCatch deal boost sentiment as earnings outperform
Visa reported strong fourth quarter and fiscal year 2026 results, with Q4 revenue rising to $12.1 billion and annual net income reaching $23.5 billion, according to Yahoo Finance. The board has also raised the quarterly dividend by 16% to $0.78 per Class A share and reaffirmed ongoing share repurchases. Additionally, Visa has announced a $2.4 billion plan to acquire BioCatch and signed new partnerships focusing on digital and AI-enabled payments.
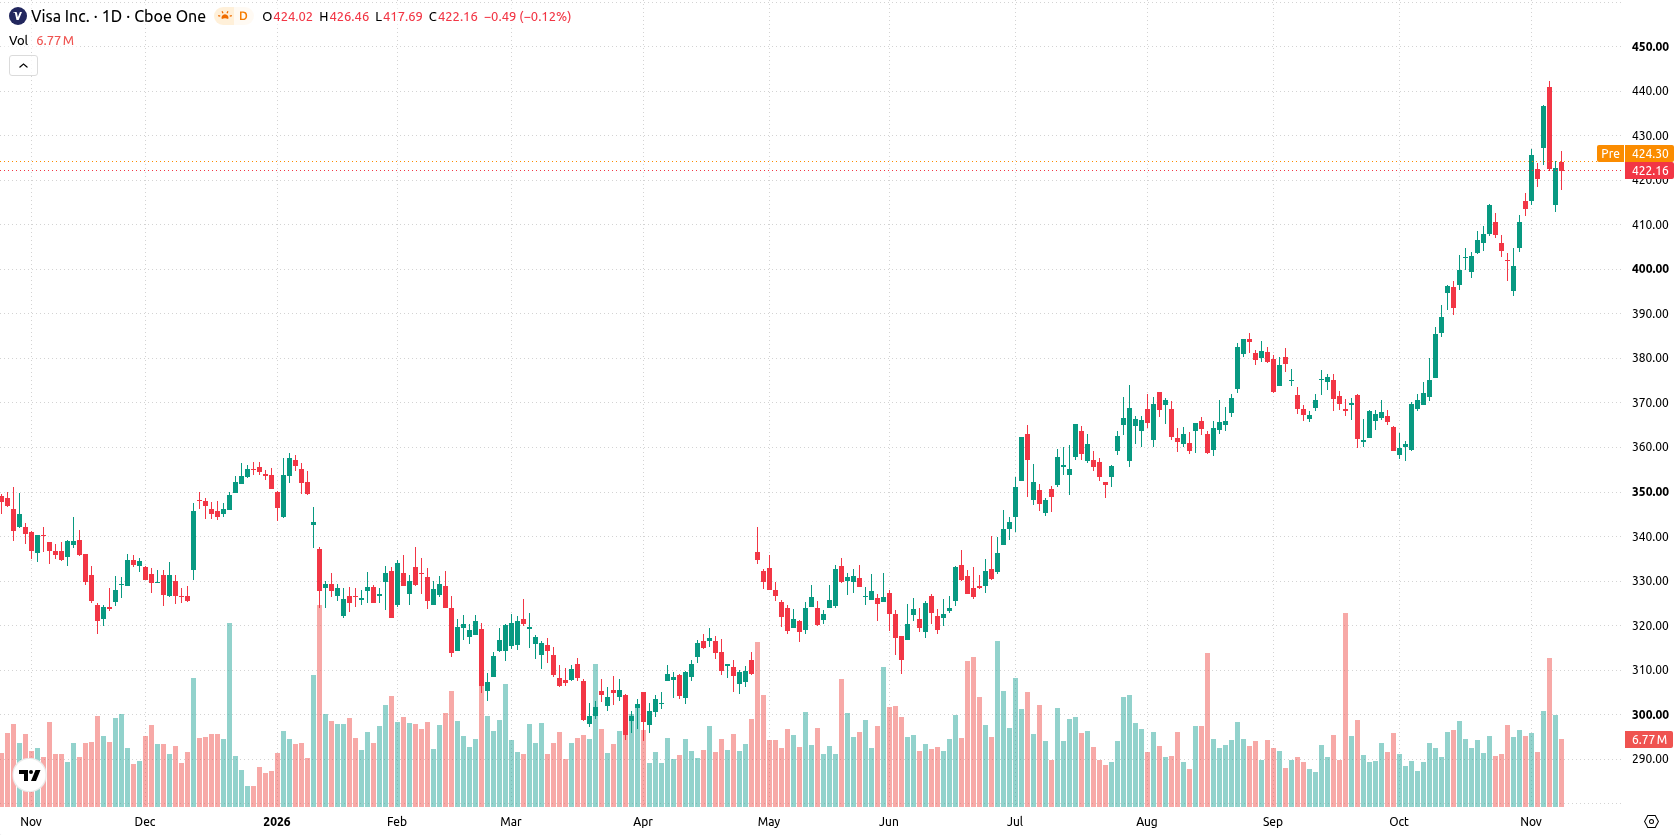
Overbought signals emerge as bullish momentum diverges across indicators
On the daily chart, the trend stays clearly defined, supported by consistently trending conditions and a sustained move lower with a firm trend. Signals are mixed, with MACD and ADX both flashing buy momentum, while Bull/Bear Power is in overbought territory, highlighting possible overheating. Oscillator readings (RSI at 63.52 and CCI at 85.3) are neutral, as is the Awesome Oscillator, while Stochastic RSI sits in the oversold zone, suggesting some divergence among indicators. Key levels to watch are support at $417.69 and resistance at $437.61, and recent volatility sits at 4.77%.
Bullish breakout risk rises if resistance is breached next week
Next week, the expected range is $412.1 to $442.84, with a very high probability of an increase and a very low probability of a decrease. The base case calls for movement within this zone, with price likely holding between support at $417.69 and resistance at $437.61. A bullish scenario would see shares break above $437.61 and challenge the top end of the expected range. If support at $417.69 fails, a move down toward $412.1 becomes plausible.
Previously it was reported that Visa expanded its blockchain settlement capabilities by adding the Monad network, further advancing its support for stablecoin-enabled payments and privacy features. With the stock trading within a well-defined range and upcoming earnings momentum and corporate actions in focus, key levels for active traders now include support at $417.69 and resistance at $437.61.






Latest Visa News





-
 Afghanistan
-
 Albania
-
 Algeria
-
 Angola
-
 Argentina
-
 Armenia
-
 Australia
-
 Austria
-
 Azerbaijan
-
 Bahamas
-
 Bahrain
-
 Bangladesh
-
 Belarus
-
 Belgium
-
 Bolivia
-
 Botswana
-
 Brazil
-
 Brunei
-
 Bulgaria
-
 Cambodia
-
 Cameroon
-
 Canada
-
 Chile
-
 China
-
 Colombia
-
 Congo
-
 Costa Rica
-
 Cote d'Ivoire
-
 Croatia
-
 Cuba
-
 Cyprus
-
 Czechia
-
 DR Congo
-
 Denmark
-
 Dominican Republic
-
 Ecuador
-
 Egypt
-
 El Salvador
-
 Estonia
-
 Eswatini
-
 Ethiopia
-
 Finland
-
 France
-
 Georgia
-
 Germany
-
 Ghana
-
 Greece
-
 Haiti
-
 Hong Kong
-
 Hungary
-
 India
-
 Indonesia
-
 Iran, Islamic republic
-
 Iraq
-
 Ireland
-
 Israel
-
 Italy
-
 Jamaica
-
 Japan
-
 Jordan
-
 Kazakhstan
-
 Kenya
-
 Korea
-
 Kuwait
-
 Kyrgyzstan
-
 Laos
-
 Latvia
-
 Lebanon
-
 Lesotho
-
 Libya
-
 Lithuania
-
 Luxembourg
-
 Madagascar
-
 Malaysia
-
 Malta
-
 Mauritius
-
 Mexico
-
 Moldova
-
 Mongolia
-
 Montenegro
-
 Morocco
-
 Mozambique
-
 Myanmar
-
 Namibia
-
 Nepal
-
 Netherlands
-
 New Zealand
-
 Nigeria
-
 North Macedonia
-
 Norway
-
 Oman
-
 Pakistan
-
 Palestine
-
 Panama
-
 Papua New Guinea
-
 Paraguay
-
 Peru
-
 Philippines
-
 Poland
-
 Portugal
-
 Puerto Rico
-
 Qatar
-
 Reunion
-
 Romania
-
 Rwanda
-
 Saudi Arabia
-
 Serbia
-
 Singapore
-
 Slovakia
-
 Slovenia
-
 Somalia
-
 South Africa
-
 Spain
-
 Sri Lanka
-
 Sweden
-
 Switzerland
-
 Syria
-
 Taiwan
-
 Tajikistan
-
 Tanzania
-
 Thailand
-
 Trinidad and Tobago
-
 Tunisia
-
 Turkey
-
 UAE
-
 Uganda
-
 Ukraine
-
 United Kingdom
-
United States
-
 Uruguay
-
 Uzbekistan
-
 Venezuela
-
 Vietnam
-
 Yemen
-
 Zambia
-
 Zimbabwe
- Forex
- Crypto












