

McDonald's shares eye consolidation as RSI and CCI highlight short-term overheating: weekly analysis

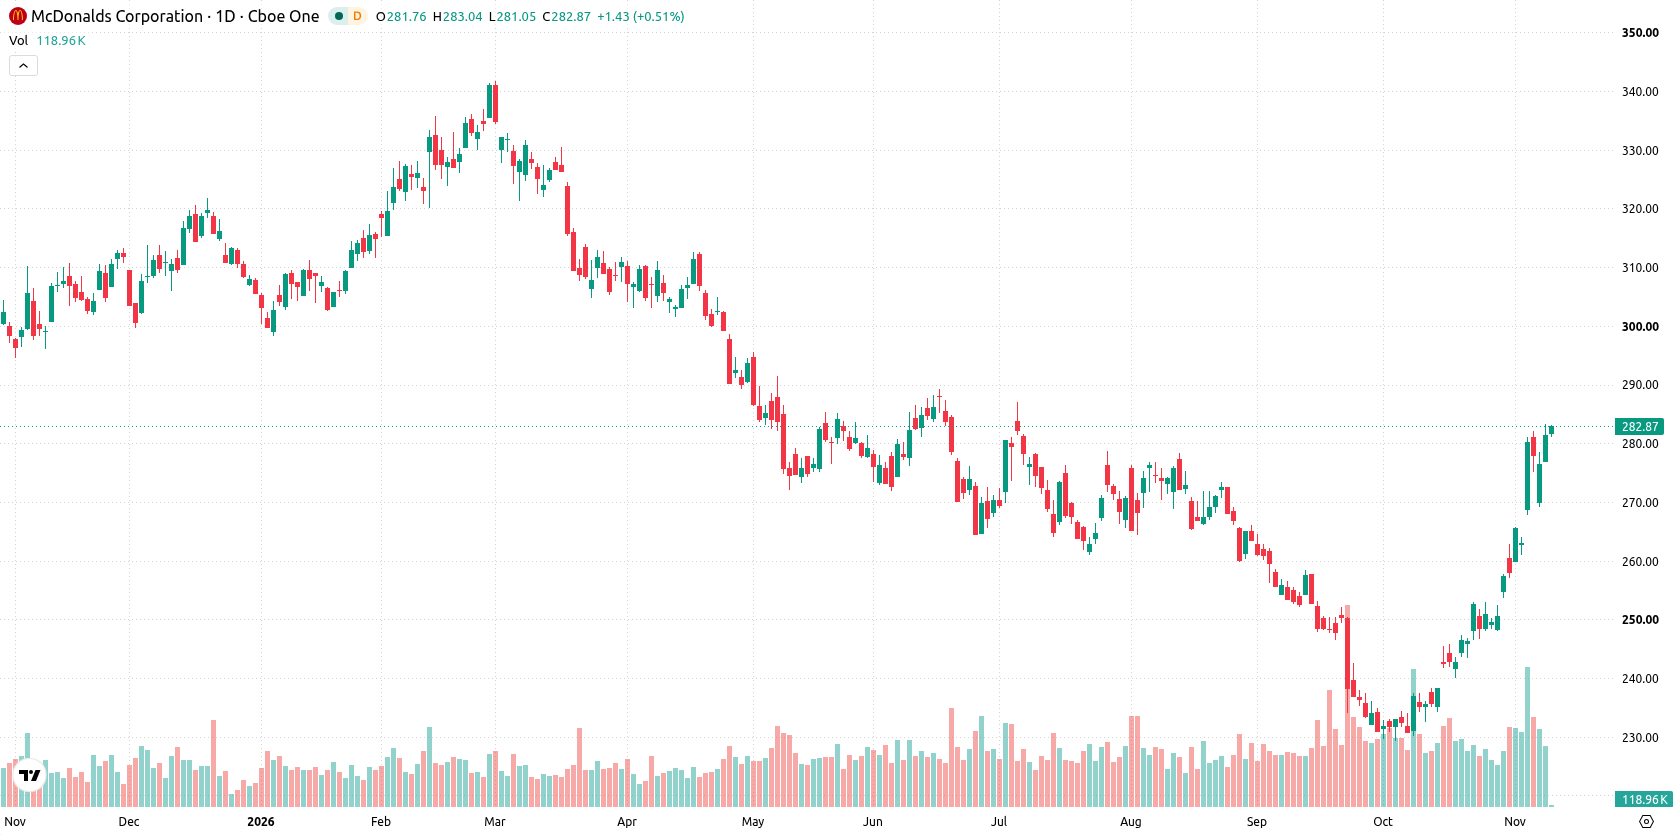
Shares of McDonald's Corporation (MCD) are trading near $280, advancing by about 1.4% over the past week as the rally tests the strength of its uptrend. Momentum indicators suggest the move may be overextended, but trend signals remain supportive — setting up a decisive technical clash in the days ahead.
 283.26
Highlights
- Shares of McDonald's rose 1.38% over the past 7 days to $280.32, maintaining a short-term uptrend above key moving averages.
- Oscillator signals warn of overbought conditions and possible near-term downside, even as trend indicators support further gains.
- A price range of $275.92 to $290.79 is expected for the coming week, with resistance at $282.22 and support at $273.34.
Profit growth and digital initiatives drive sentiment amid sustained dividend hikes
MCD posted higher third quarter profitability, with adjusted earnings per share at $3.57 and revenue up 1% to $7.16 billion, according to CNBC. The company increased its quarterly dividend by 4% to $1.93 per share, marking 50 consecutive years of payout hikes and reaffirming its Dividend King status, as reported by 24/7 Wall St. Late in the quarter, cost controls and digital promotions restored U.S. traffic and new value bundles were tested in roughly 1,900 locations, while a multi-year expansion of McDonald's partnership with Uber will introduce app-based rewards in 14 global markets.
Momentum divergence warns of correction as overbought signals clash with trend strength
On the daily chart, the structure reveals a strong, sustained move higher with a firm trend, underscored by a weekly volatility of 3.59%. Both RSI and CCI are firmly in overbought territory at 76.52 and 150.23, highlighting the risk of short-term overheating and potential for a downside correction. At the same time, trend-focused signals such as MACD and ADX remain in buy territory, creating a divergence between momentum and oscillator signals. Immediate support is found at $273.34, while resistance aligns with the 200-day average at $282.22.
Range-bound bias likely as breakout depends on support and resistance levels next week
Over the coming trading week, McDonald's stock is expected to fluctuate within a range of $275.92 to $290.79. There is a 74% probability of an increase and a 26% chance of a decrease. The base case sees consolidation and further attempts higher as long as the price holds between $273.34 and $282.22. A break above $282.22 would open the way to test the upper end of the range, while a loss of support at $273.34 would expose the stock to near-term corrective downside.
Earlier, analysts noted that McDonald's stock was benefiting from positive momentum and a focus on shareholder returns, even as mixed sales trends presented challenges. New technical and fundamental data outlined here add important context, with the breakout above $282.22 emerging as a key level that could define the next phase of price action.






Latest McDonald’s News




-
 Afghanistan
-
 Albania
-
 Algeria
-
 Angola
-
 Argentina
-
 Armenia
-
 Australia
-
 Austria
-
 Azerbaijan
-
 Bahamas
-
 Bahrain
-
 Bangladesh
-
 Belarus
-
 Belgium
-
 Bolivia
-
 Botswana
-
 Brazil
-
 Brunei
-
 Bulgaria
-
 Cambodia
-
 Cameroon
-
 Canada
-
 Chile
-
 China
-
 Colombia
-
 Congo
-
 Costa Rica
-
 Cote d'Ivoire
-
 Croatia
-
 Cuba
-
 Cyprus
-
 Czechia
-
 DR Congo
-
 Denmark
-
 Dominican Republic
-
 Ecuador
-
 Egypt
-
 El Salvador
-
 Estonia
-
 Eswatini
-
 Ethiopia
-
 Finland
-
 France
-
 Georgia
-
 Germany
-
 Ghana
-
 Greece
-
 Haiti
-
 Hong Kong
-
 Hungary
-
 India
-
 Indonesia
-
 Iran, Islamic republic
-
 Iraq
-
 Ireland
-
 Israel
-
 Italy
-
 Jamaica
-
 Japan
-
 Jordan
-
 Kazakhstan
-
 Kenya
-
 Korea
-
 Kuwait
-
 Kyrgyzstan
-
 Laos
-
 Latvia
-
 Lebanon
-
 Lesotho
-
 Libya
-
 Lithuania
-
 Luxembourg
-
 Madagascar
-
 Malaysia
-
 Malta
-
 Mauritius
-
 Mexico
-
 Moldova
-
 Mongolia
-
 Montenegro
-
 Morocco
-
 Mozambique
-
 Myanmar
-
 Namibia
-
 Nepal
-
 Netherlands
-
 New Zealand
-
 Nigeria
-
 North Macedonia
-
 Norway
-
 Oman
-
 Pakistan
-
 Palestine
-
 Panama
-
 Papua New Guinea
-
 Paraguay
-
 Peru
-
 Philippines
-
 Poland
-
 Portugal
-
 Puerto Rico
-
 Qatar
-
 Reunion
-
 Romania
-
 Rwanda
-
 Saudi Arabia
-
 Serbia
-
 Singapore
-
 Slovakia
-
 Slovenia
-
 Somalia
-
 South Africa
-
 Spain
-
 Sri Lanka
-
 Sweden
-
 Switzerland
-
 Syria
-
 Taiwan
-
 Tajikistan
-
 Tanzania
-
 Thailand
-
 Trinidad and Tobago
-
 Tunisia
-
 Turkey
-
 UAE
-
 Uganda
-
 Ukraine
-
 United Kingdom
-
United States
-
 Uruguay
-
 Uzbekistan
-
 Venezuela
-
 Vietnam
-
 Yemen
-
 Zambia
-
 Zimbabwe
- Forex
- Crypto












