

BTBT moves lower as seller pressure dominates short-term trend

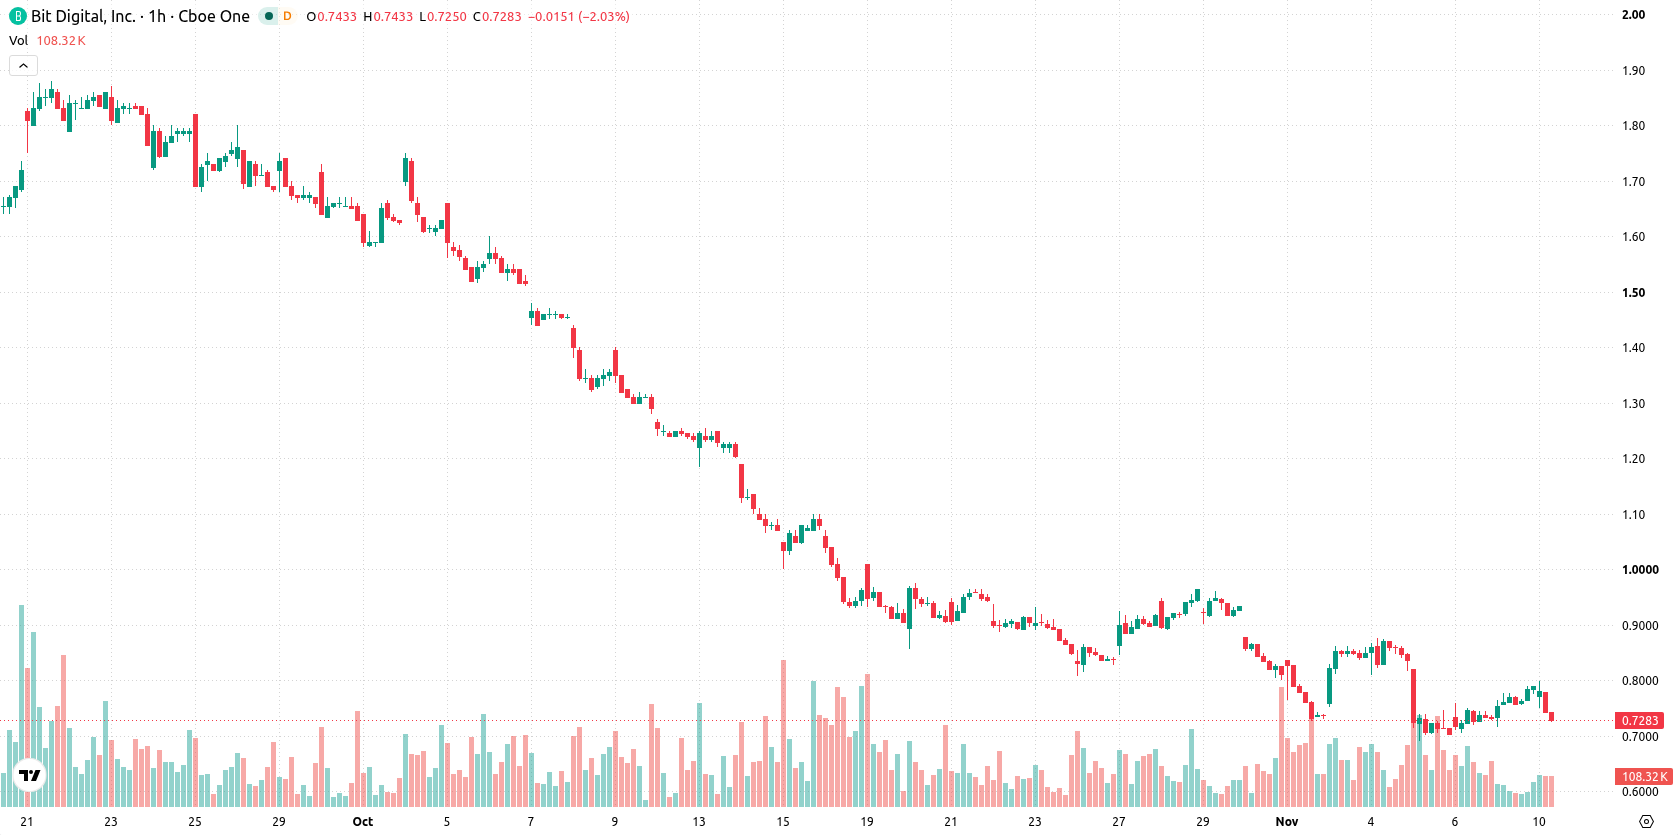
Bit Digital (BTBT) stock is trading at $0.72, down 7.69% on the day and extending its slide below key short- and medium-term moving averages.
 0.7993
0.8749
Highlights
- Shares of Bit Digital fell to $0.72, declining 7.69% on high volatility and closing near the session low.
- Bit Digital stock trades below key short, medium, and long-term moving averages, indicating a sustained bearish trend.
- Expected trading range is $0.65 to $0.81 over the next several days, with high probability of continued downside.
Bearish momentum persists as key supports and oscillators diverge
On the technical chart, BTBT is trading below its MA-20 and MA-50 on the H1 timeframe and remains well under the MA-200 on the daily chart. Immediate resistance is marked by the Ichimoku Kijun level at $0.78, while the nearest support is aligned with $0.65. MACD indicates strong downside momentum, even as ADX reads neutral, suggesting indecisive trend strength. RSI and CCI are both neutral, while Stochastic RSI is deeply oversold—a sign of short-term selling exhaustion, though not yet pointing to a reversal. Bull/Bear Power is slightly negative, reflecting intraday seller control, and the Awesome Oscillator is neutral. Divergence is seen with Stochastic RSI oversold but other oscillators holding neutral, as overall momentum signals remain bearish.
Downside forecast favored as volatility band narrows
In the short term, BTBT is expected to trade within a $0.65 to $0.81 volatility band. The probability of an upward move is currently very low, while a further decline remains highly probable. Baseline scenario foresees the price moving sideways within this corridor; a bullish breakout would require a move above the $0.78 resistance, while a bearish case unfolds if $0.65 support is lost.
Earlier, analysts noted that Bit Digital faced persistent bearish pressure as mixed technical signals suggested heightened volatility and a cautious outlook. With the latest breakdown below key moving averages and mounting downside momentum, the $0.65 support level has emerged as the critical threshold traders should monitor for signals of either further decline or potential stabilization.






Latest Bit Digital News



-
 Afghanistan
-
 Albania
-
 Algeria
-
 Angola
-
 Argentina
-
 Armenia
-
 Australia
-
 Austria
-
 Azerbaijan
-
 Bahamas
-
 Bahrain
-
 Bangladesh
-
 Belarus
-
 Belgium
-
 Bolivia
-
 Botswana
-
 Brazil
-
 Brunei
-
 Bulgaria
-
 Cambodia
-
 Cameroon
-
 Canada
-
 Chile
-
 China
-
 Colombia
-
 Congo
-
 Costa Rica
-
 Cote d'Ivoire
-
 Croatia
-
 Cuba
-
 Cyprus
-
 Czechia
-
 DR Congo
-
 Denmark
-
 Dominican Republic
-
 Ecuador
-
 Egypt
-
 El Salvador
-
 Estonia
-
 Eswatini
-
 Ethiopia
-
 Finland
-
 France
-
 Georgia
-
 Germany
-
 Ghana
-
 Greece
-
 Haiti
-
 Hong Kong
-
 Hungary
-
 India
-
 Indonesia
-
 Iran, Islamic republic
-
 Iraq
-
 Ireland
-
 Israel
-
 Italy
-
 Jamaica
-
 Japan
-
 Jordan
-
 Kazakhstan
-
 Kenya
-
 Korea
-
 Kuwait
-
 Kyrgyzstan
-
 Laos
-
 Latvia
-
 Lebanon
-
 Lesotho
-
 Libya
-
 Lithuania
-
 Luxembourg
-
 Madagascar
-
 Malaysia
-
 Malta
-
 Mauritius
-
 Mexico
-
 Moldova
-
 Mongolia
-
 Montenegro
-
 Morocco
-
 Mozambique
-
 Myanmar
-
 Namibia
-
 Nepal
-
 Netherlands
-
 New Zealand
-
 Nigeria
-
 North Macedonia
-
 Norway
-
 Oman
-
 Pakistan
-
 Palestine
-
 Panama
-
 Papua New Guinea
-
 Paraguay
-
 Peru
-
 Philippines
-
 Poland
-
 Portugal
-
 Puerto Rico
-
 Qatar
-
 Reunion
-
 Romania
-
 Rwanda
-
 Saudi Arabia
-
 Serbia
-
 Singapore
-
 Slovakia
-
 Slovenia
-
 Somalia
-
 South Africa
-
 Spain
-
 Sri Lanka
-
 Sweden
-
 Switzerland
-
 Syria
-
 Taiwan
-
 Tajikistan
-
 Tanzania
-
 Thailand
-
 Trinidad and Tobago
-
 Tunisia
-
 Turkey
-
 UAE
-
 Uganda
-
 Ukraine
-
 United Kingdom
-
United States
-
 Uruguay
-
 Uzbekistan
-
 Venezuela
-
 Vietnam
-
 Yemen
-
 Zambia
-
 Zimbabwe
- Forex
- Crypto












