

LEN slides nearly 5% as technicals flash mixed signals despite surge in institutional holdings

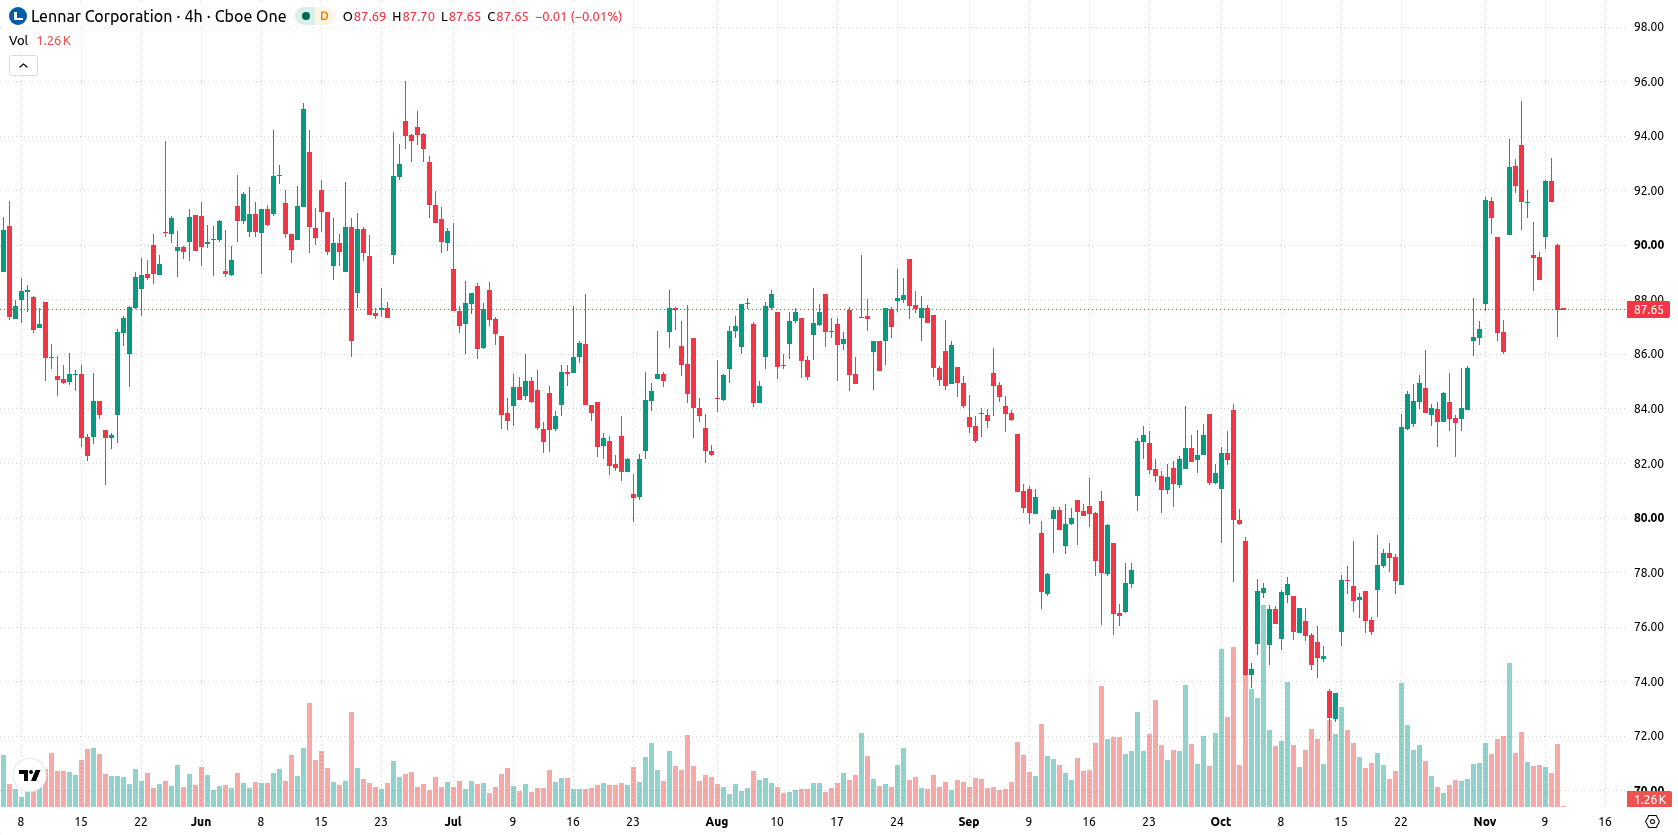
Lennar Corporation (LEN) fell 4.66% today, with the decline coming even as recent filings showed a substantial increase in institutional holdings by Fulcrum Asset Management. The sharp move lower finds some support near recent moving averages but faces persistent long-term resistance on the charts.
 84.18
93.17
Highlights
- Fulcrum Asset Management LLP increased its position in Lennar by 269.6% during the third quarter, indicating substantial institutional allocation.
- The period saw active institutional trading activity, with no new regulatory or product developments disclosed for Lennar.
- Shares of Lennar declined 4.66% today despite showing bullish momentum indicators, and are projected to trade between $83.63 and $90.66 over the next five sessions.
Accelerated institutional inflows as broad selling restrains gains
Fulcrum Asset Management LLP significantly increased its holdings in Lennar, raising its position by 269.6% in the third quarter according to its latest SEC filing. Additional reporting noted active institutional participation during the period. No new regulatory or product-specific developments were disclosed, though price action has remained under broader selling pressure.
Mixed momentum signals as overbought readings clash with bullish trend
Lennar is currently trading above both its 20-day and 50-day moving averages at $83.53 and $81.49, signaling continued short- and medium-term bullish momentum. However, the stock remains beneath the 200-day moving average at $90.44, which highlights ongoing long-term resistance. The closest support and resistance are at $86.63 and $88.48. Various momentum indicators show a mixed setup: MACD, ADX, and the Awesome Oscillator point to underlying bullish momentum. The Relative Strength Index (RSI) and Stochastic RSI are neutral, whereas the Commodity Channel Index (CCI) is in the overbought range, flagging possible risk of a short-term correction. Bull/Bear Power (BBP) remains positive, reflecting dominance by buyers in intraday trading. Lennar saw a $4.27, or 4.66%, drop on the day, opening with a gap down near 1.74% and closing near session lows. Intraday volatility stood at 3.90%, reinforcing the sense of ongoing sell-side pressure. The coexistence of neutral oscillators, bullish momentum readings, and an overbought CCI reflects a divergence between strong trend signals and risks of a short-term pullback.
Earlier, analysts noted that Lennar was experiencing increased institutional activity amid heightened volatility and mixed technical signals, with uncertainty persisting over longer-term resistance. The latest data reinforce this outlook, emphasizing that a sustained move above $90.66 remains the pivotal level to confirm a bullish breakout in the sessions ahead.










-
 Afghanistan
-
 Albania
-
 Algeria
-
 Angola
-
 Argentina
-
 Armenia
-
 Australia
-
 Austria
-
 Azerbaijan
-
 Bahamas
-
 Bahrain
-
 Bangladesh
-
 Belarus
-
 Belgium
-
 Bolivia
-
 Botswana
-
 Brazil
-
 Brunei
-
 Bulgaria
-
 Cambodia
-
 Cameroon
-
 Canada
-
 Chile
-
 China
-
 Colombia
-
 Congo
-
 Costa Rica
-
 Cote d'Ivoire
-
 Croatia
-
 Cuba
-
 Cyprus
-
 Czechia
-
 DR Congo
-
 Denmark
-
 Dominican Republic
-
 Ecuador
-
 Egypt
-
 El Salvador
-
 Estonia
-
 Eswatini
-
 Ethiopia
-
 Finland
-
 France
-
 Georgia
-
 Germany
-
 Ghana
-
 Greece
-
 Haiti
-
 Hong Kong
-
 Hungary
-
 India
-
 Indonesia
-
 Iran, Islamic republic
-
 Iraq
-
 Ireland
-
 Israel
-
 Italy
-
 Jamaica
-
 Japan
-
 Jordan
-
 Kazakhstan
-
 Kenya
-
 Korea
-
 Kuwait
-
 Kyrgyzstan
-
 Laos
-
 Latvia
-
 Lebanon
-
 Lesotho
-
 Libya
-
 Lithuania
-
 Luxembourg
-
 Madagascar
-
 Malaysia
-
 Malta
-
 Mauritius
-
 Mexico
-
 Moldova
-
 Mongolia
-
 Montenegro
-
 Morocco
-
 Mozambique
-
 Myanmar
-
 Namibia
-
 Nepal
-
 Netherlands
-
 New Zealand
-
 Nigeria
-
 North Macedonia
-
 Norway
-
 Oman
-
 Pakistan
-
 Palestine
-
 Panama
-
 Papua New Guinea
-
 Paraguay
-
 Peru
-
 Philippines
-
 Poland
-
 Portugal
-
 Puerto Rico
-
 Qatar
-
 Reunion
-
 Romania
-
 Rwanda
-
 Saudi Arabia
-
 Serbia
-
 Singapore
-
 Slovakia
-
 Slovenia
-
 Somalia
-
 South Africa
-
 Spain
-
 Sri Lanka
-
 Sweden
-
 Switzerland
-
 Syria
-
 Taiwan
-
 Tajikistan
-
 Tanzania
-
 Thailand
-
 Trinidad and Tobago
-
 Tunisia
-
 Turkey
-
 UAE
-
 Uganda
-
 Ukraine
-
 United Kingdom
-
United States
-
 Uruguay
-
 Uzbekistan
-
 Venezuela
-
 Vietnam
-
 Yemen
-
 Zambia
-
 Zimbabwe
- Forex
- Crypto












