

Shopify stock falls amid renewed selling and technical pressure

Shopify Inc. (SHOP) stock is trading at $145.20, down 4.51% today as the price sits near the session low. The stock is currently positioned below its key short- and medium-term moving averages, indicating near-term selling pressure, but remains supported above longer-term trend levels.
 150.34
152.52
Highlights
- Shopify reported third-quarter 2026 revenue of $3.74 billion, up 32%, with gross merchandise volume at $119 billion.
- Annual 2026 results show revenue of $11.56 billion and net profit of $1.23 billion, with growing institutional share accumulation.
- Shopify stock trades below key moving averages with technical indicators neutral and projected range at $138.26 to $152.14, favoring downside risk.
Institutional accumulation and strong earnings amid persistent price pressure
Shopify reported a 32% increase in third-quarter 2026 revenue to $3.74 billion, with gross merchandise volume reaching $119 billion, indicating robust transaction growth and strong demand, according to Kalkine. Annual results for 2026 showed revenue of $11.56 billion and net profit of $1.23 billion, confirming the company's sustained profitability and operational scale, as reported by TradingKey. Additional ETF inflows, documented by Yahoo Finance, point to continued institutional interest, while recent filings show increased share accumulation by CenterBook Partners LP and Allspring Global Investments Holdings LLC. These developments highlight solid business performance and incremental institutional support, though price action has remained under broader selling pressure.
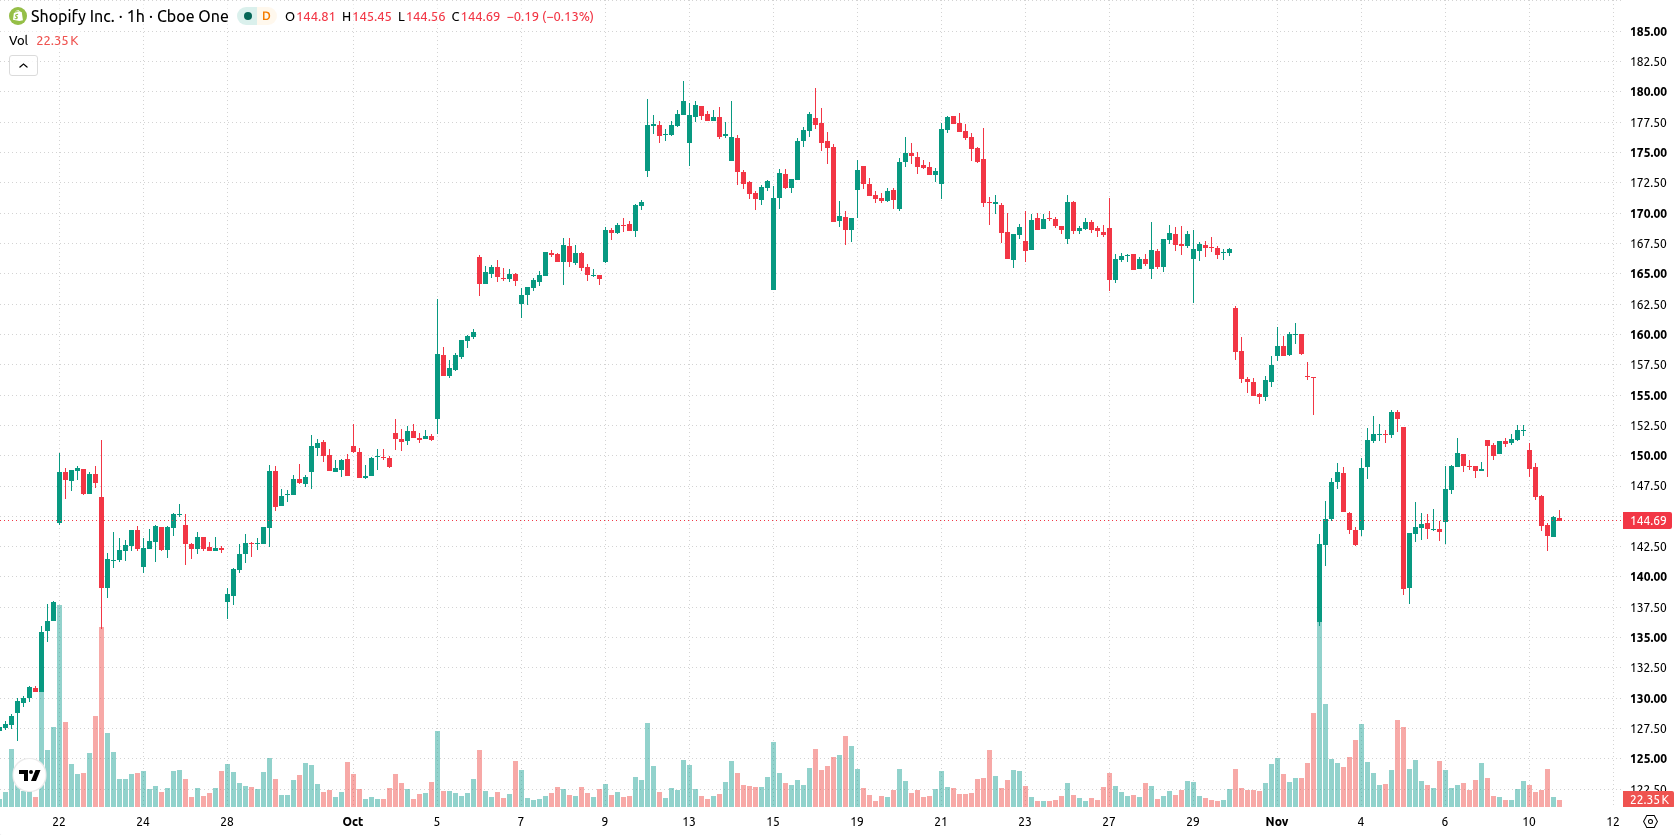
Neutral momentum diverges from resistance cluster and mild buying
SHOP is trading below the MA-20 at $148.24 and the MA-50 at $151.03, which confirms both short- and medium-term resistance, while the MA-200 at $130 provides significant longer-term support. The Ichimoku Kijun is positioned at $145.74, acting as immediate resistance on the near-term chart. Momentum indicators, including MACD and ADX, are neutral, with RSI and CCI both reflecting a balanced state, though the Stoch RSI is in overbought territory. Bull/Bear Power remains positive at 2.26, indicating mild buyer dominance despite today's moderate volatility and the divergence with neutral momentum readings and the sharp intraday decline.
Downside bias as breakout prospects remain limited near volatility band
In the short term, SHOP is expected to trade within a range of $138.26 to $152.14, reflecting a typical volatility band relative to current levels. The probability of an upward move is assessed as very low, while a downward move toward range support is considered highly likely. A bullish scenario requires a break above immediate resistance, while a bearish scenario could see price declining toward $138.26 if support fails.
Earlier, analysts noted that executive pay packages tied to performance and long-term retention have become a significant governance focus in South Africa’s public retail sector. While Shopify operates in a different jurisdiction and industry, the present technical outlook signals an increased need for traders to monitor the $138.26 level as a critical near-term support, as a downside move below this threshold could accelerate selling pressure.











-
 Afghanistan
-
 Albania
-
 Algeria
-
 Angola
-
 Argentina
-
 Armenia
-
 Australia
-
 Austria
-
 Azerbaijan
-
 Bahamas
-
 Bahrain
-
 Bangladesh
-
 Belarus
-
 Belgium
-
 Bolivia
-
 Botswana
-
 Brazil
-
 Brunei
-
 Bulgaria
-
 Cambodia
-
 Cameroon
-
 Canada
-
 Chile
-
 China
-
 Colombia
-
 Congo
-
 Costa Rica
-
 Cote d'Ivoire
-
 Croatia
-
 Cuba
-
 Cyprus
-
 Czechia
-
 DR Congo
-
 Denmark
-
 Dominican Republic
-
 Ecuador
-
 Egypt
-
 El Salvador
-
 Estonia
-
 Eswatini
-
 Ethiopia
-
 Finland
-
 France
-
 Georgia
-
 Germany
-
 Ghana
-
 Greece
-
 Haiti
-
 Hong Kong
-
 Hungary
-
 India
-
 Indonesia
-
 Iran, Islamic republic
-
 Iraq
-
 Ireland
-
 Israel
-
 Italy
-
 Jamaica
-
 Japan
-
 Jordan
-
 Kazakhstan
-
 Kenya
-
 Korea
-
 Kuwait
-
 Kyrgyzstan
-
 Laos
-
 Latvia
-
 Lebanon
-
 Lesotho
-
 Libya
-
 Lithuania
-
 Luxembourg
-
 Madagascar
-
 Malaysia
-
 Malta
-
 Mauritius
-
 Mexico
-
 Moldova
-
 Mongolia
-
 Montenegro
-
 Morocco
-
 Mozambique
-
 Myanmar
-
 Namibia
-
 Nepal
-
 Netherlands
-
 New Zealand
-
 Nigeria
-
 North Macedonia
-
 Norway
-
 Oman
-
 Pakistan
-
 Palestine
-
 Panama
-
 Papua New Guinea
-
 Paraguay
-
 Peru
-
 Philippines
-
 Poland
-
 Portugal
-
 Puerto Rico
-
 Qatar
-
 Reunion
-
 Romania
-
 Rwanda
-
 Saudi Arabia
-
 Serbia
-
 Singapore
-
 Slovakia
-
 Slovenia
-
 Somalia
-
 South Africa
-
 Spain
-
 Sri Lanka
-
 Sweden
-
 Switzerland
-
 Syria
-
 Taiwan
-
 Tajikistan
-
 Tanzania
-
 Thailand
-
 Trinidad and Tobago
-
 Tunisia
-
 Turkey
-
 UAE
-
 Uganda
-
 Ukraine
-
 United Kingdom
-
United States
-
 Uruguay
-
 Uzbekistan
-
 Venezuela
-
 Vietnam
-
 Yemen
-
 Zambia
-
 Zimbabwe
- Forex
- Crypto












