

AST SpaceMobile stock price prediction: Downward momentum persists amid wide intraday swings

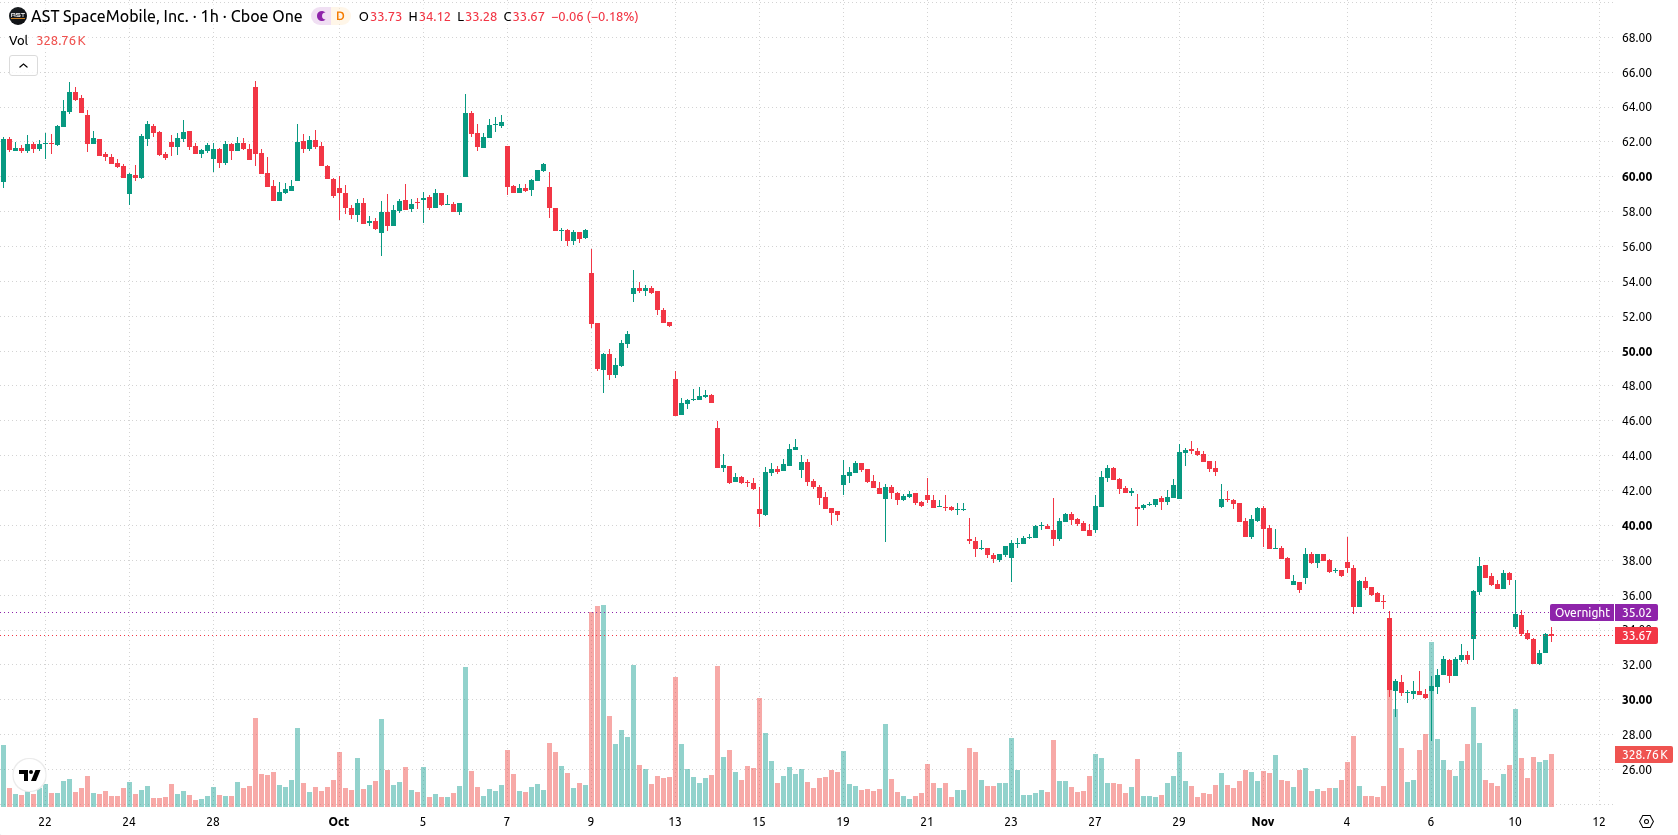
AST SpaceMobile (ASTS) stock is trading at $33.69, marking a daily decrease of 8.67%. The price stands below its key moving averages amid notable intraday volatility.
 34.50
38.11
Highlights
- AST SpaceMobile reported $42.3 million in revenue for the third quarter of 2026, up 187% year over year but below analyst expectations.
- The company secured up to $1 billion in Japanese government support for its Rakuten AST joint venture to fund its direct-to-device satellite network, ending the quarter with $3.2 billion in cash and $4.08 billion in long-term debt.
- Shares of AST SpaceMobile trade below key moving averages with strong bearish technical signals, and price is likely to remain between $28.54 and $38.84 over the next 2 to 3 trading days.
Earnings miss and government support widen sentiment gap
AST SpaceMobile reported third-quarter 2026 revenue of $42.3 million, reflecting a 187% year-over-year increase, but this figure came in below analyst expectations, according to Investing.com. The earnings shortfall contributed to weaker sentiment, with the discrepancy against consensus estimates raising short-term uncertainty around growth momentum. Separately, the company secured up to $1 billion in Japanese government support for its Rakuten AST joint venture to fund its direct-to-device satellite network buildout, and it ended the quarter with $3.2 billion in cash against $4.08 billion in long-term debt, according to Yahoo Finance.
Bearish momentum persists as technicals reinforce downside risk
ASTS trades below the MA-20 at $34.24, the MA-50 at $35.07, and the much higher MA-200 at $74.87. Immediate support is marked by the Ichimoku Kijun at $32.89. MACD and ADX both indicate continued bearish momentum. All three oscillators—RSI at 46.9, Stoch RSI at 30.74, and CCI at –18.24—are in neutral zones, highlighting the absence of any extreme conditions. Bull/Bear Power is slightly negative at –0.04, reflecting mild seller dominance intraday. The Awesome Oscillator further supports the prevailing bearish tone.
Downside bias prevails as volatility and support boundaries widen
Over the next two to three trading days, ASTS is expected to fluctuate in a wide volatility band between $28.54 and $38.84. The probability of a near-term rebound is very low, while the likelihood of further downside is notably higher. Consolidation within this range represents the base scenario. Should the price surge above resistance, a bullish scenario could develop, while a breach of the $32.89 support may drive additional losses.
Previously it was reported that AST SpaceMobile remained under persistent bearish pressure, with technical indicators signaling a higher probability of further downside. The current price action strengthens this view, as continued volatility below key moving averages leaves $32.89 as a critical level to monitor for any potential shift in trend.






Latest AST SpaceMobile News



-
 Afghanistan
-
 Albania
-
 Algeria
-
 Angola
-
 Argentina
-
 Armenia
-
 Australia
-
 Austria
-
 Azerbaijan
-
 Bahamas
-
 Bahrain
-
 Bangladesh
-
 Belarus
-
 Belgium
-
 Bolivia
-
 Botswana
-
 Brazil
-
 Brunei
-
 Bulgaria
-
 Cambodia
-
 Cameroon
-
 Canada
-
 Chile
-
 China
-
 Colombia
-
 Congo
-
 Costa Rica
-
 Cote d'Ivoire
-
 Croatia
-
 Cuba
-
 Cyprus
-
 Czechia
-
 DR Congo
-
 Denmark
-
 Dominican Republic
-
 Ecuador
-
 Egypt
-
 El Salvador
-
 Estonia
-
 Eswatini
-
 Ethiopia
-
 Finland
-
 France
-
 Georgia
-
 Germany
-
 Ghana
-
 Greece
-
 Haiti
-
 Hong Kong
-
 Hungary
-
 India
-
 Indonesia
-
 Iran, Islamic republic
-
 Iraq
-
 Ireland
-
 Israel
-
 Italy
-
 Jamaica
-
 Japan
-
 Jordan
-
 Kazakhstan
-
 Kenya
-
 Korea
-
 Kuwait
-
 Kyrgyzstan
-
 Laos
-
 Latvia
-
 Lebanon
-
 Lesotho
-
 Libya
-
 Lithuania
-
 Luxembourg
-
 Madagascar
-
 Malaysia
-
 Malta
-
 Mauritius
-
 Mexico
-
 Moldova
-
 Mongolia
-
 Montenegro
-
 Morocco
-
 Mozambique
-
 Myanmar
-
 Namibia
-
 Nepal
-
 Netherlands
-
 New Zealand
-
 Nigeria
-
 North Macedonia
-
 Norway
-
 Oman
-
 Pakistan
-
 Palestine
-
 Panama
-
 Papua New Guinea
-
 Paraguay
-
 Peru
-
 Philippines
-
 Poland
-
 Portugal
-
 Puerto Rico
-
 Qatar
-
 Reunion
-
 Romania
-
 Rwanda
-
 Saudi Arabia
-
 Serbia
-
 Singapore
-
 Slovakia
-
 Slovenia
-
 Somalia
-
 South Africa
-
 Spain
-
 Sri Lanka
-
 Sweden
-
 Switzerland
-
 Syria
-
 Taiwan
-
 Tajikistan
-
 Tanzania
-
 Thailand
-
 Trinidad and Tobago
-
 Tunisia
-
 Turkey
-
 UAE
-
 Uganda
-
 Ukraine
-
 United Kingdom
-
United States
-
 Uruguay
-
 Uzbekistan
-
 Venezuela
-
 Vietnam
-
 Yemen
-
 Zambia
-
 Zimbabwe
- Forex
- Crypto












