

National Grid stock consolidates as buyer support helps defend the 200-day moving average

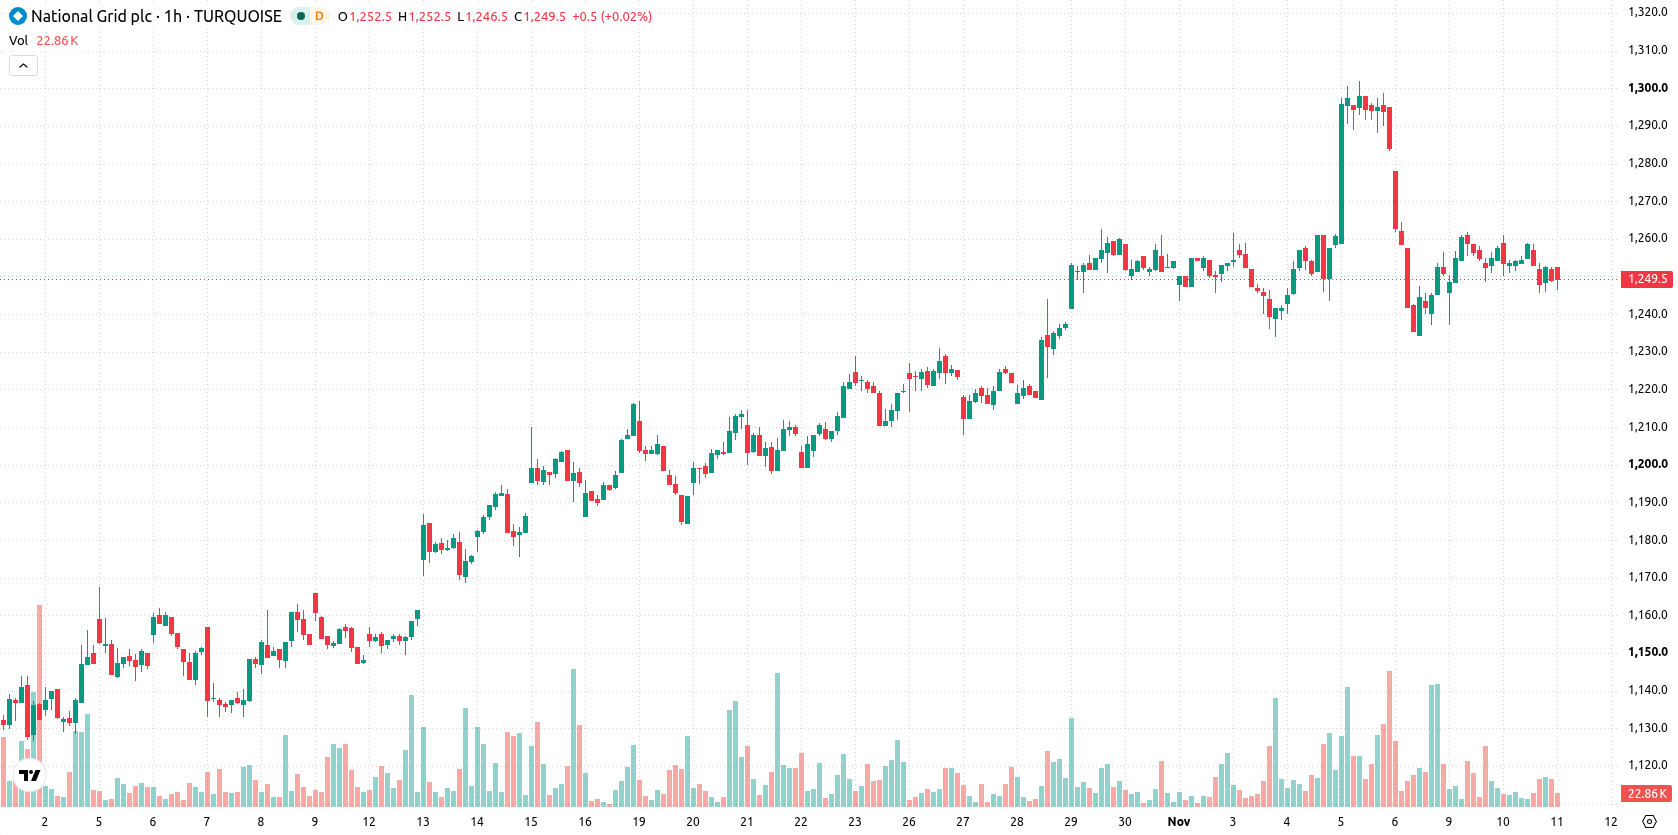
National Grid (NG) stock is trading at GBX1,248.50, registering a modest daily rise. The price is currently sitting below its short- and medium-term moving averages but continues to hold above the longer-term trend indicators.
 1279.50
Highlights
- National Grid shares trade below key short- and medium-term moving averages, confirming prevailing bearish momentum.
- MACD and ADX indicate a bearish bias, with the CCI oversold and other oscillators suggesting limited rebound evidence.
- Share price ended at GBX1,248 and is likely to trade in a GBX1,218 to GBX1,278 range with a 65% probability of moving lower.
Bearish bias amid technical support and weak momentum signals
The stock closed below the MA-20 (GBX1,253) and MA-50 (GBX1,259), while managing to remain above the MA-200 (GBX1,239) on the daily timeframe. The Ichimoku Kijun line at GBX1,248 acts as immediate support. MACD and ADX both indicate a bias toward bearish momentum. While RSI and Stochastic RSI are positioned in neutral zones, CCI is oversold, suggesting some latent rebound potential—though this is not yet reflected by other oscillators. Bull/Bear Power shows a small positive value of 0.31, pointing to marginal buyer dominance on an intraday basis, and the Awesome Oscillator remains neutral.
Sideways trend likely as downside risk outweighs rebound odds
Over the coming sessions, the price is likely to fluctuate within a typical volatility band defined by support at GBX1,218 and resistance at GBX1,278. Statistically, there is a 65% probability of a downward move versus a 35% probability of a recovery higher. Barring a breakout from this range, the baseline scenario is for sideways movement, with a bullish breakout signaling enhanced buying interest and a decline below support possibly triggering further weakness.
Earlier, analysts noted that National Grid exhibited mixed technical momentum, with balanced risks pointing to a sideways price trend. The latest data reinforce this outlook, suggesting traders should monitor for a breakout of the established range between GBX1,218 and GBX1,278 as the next key directional signal.






Latest National Grid News





-
 Afghanistan
-
 Albania
-
 Algeria
-
 Angola
-
 Argentina
-
 Armenia
-
 Australia
-
 Austria
-
 Azerbaijan
-
 Bahamas
-
 Bahrain
-
 Bangladesh
-
 Belarus
-
 Belgium
-
 Bolivia
-
 Botswana
-
 Brazil
-
 Brunei
-
 Bulgaria
-
 Cambodia
-
 Cameroon
-
 Canada
-
 Chile
-
 China
-
 Colombia
-
 Congo
-
 Costa Rica
-
 Cote d'Ivoire
-
 Croatia
-
 Cuba
-
 Cyprus
-
 Czechia
-
 DR Congo
-
 Denmark
-
 Dominican Republic
-
 Ecuador
-
 Egypt
-
 El Salvador
-
 Estonia
-
 Eswatini
-
 Ethiopia
-
 Finland
-
 France
-
 Georgia
-
 Germany
-
 Ghana
-
 Greece
-
 Haiti
-
 Hong Kong
-
 Hungary
-
 India
-
 Indonesia
-
 Iran, Islamic republic
-
 Iraq
-
 Ireland
-
 Israel
-
 Italy
-
 Jamaica
-
 Japan
-
 Jordan
-
 Kazakhstan
-
 Kenya
-
 Korea
-
 Kuwait
-
 Kyrgyzstan
-
 Laos
-
 Latvia
-
 Lebanon
-
 Lesotho
-
 Libya
-
 Lithuania
-
 Luxembourg
-
 Madagascar
-
 Malaysia
-
 Malta
-
 Mauritius
-
 Mexico
-
 Moldova
-
 Mongolia
-
 Montenegro
-
 Morocco
-
 Mozambique
-
 Myanmar
-
 Namibia
-
 Nepal
-
 Netherlands
-
 New Zealand
-
 Nigeria
-
 North Macedonia
-
 Norway
-
 Oman
-
 Pakistan
-
 Palestine
-
 Panama
-
 Papua New Guinea
-
 Paraguay
-
 Peru
-
 Philippines
-
 Poland
-
 Portugal
-
 Puerto Rico
-
 Qatar
-
 Reunion
-
 Romania
-
 Rwanda
-
 Saudi Arabia
-
 Serbia
-
 Singapore
-
 Slovakia
-
 Slovenia
-
 Somalia
-
 South Africa
-
 Spain
-
 Sri Lanka
-
 Sweden
-
 Switzerland
-
 Syria
-
 Taiwan
-
 Tajikistan
-
 Tanzania
-
 Thailand
-
 Trinidad and Tobago
-
 Tunisia
-
 Turkey
-
 UAE
-
 Uganda
-
 Ukraine
-
 United Kingdom
-
United States
-
 Uruguay
-
 Uzbekistan
-
 Venezuela
-
 Vietnam
-
 Yemen
-
 Zambia
-
 Zimbabwe
- Forex
- Crypto












