

IBM stock faces resistance at MA-20 with neutral momentum readings capping upside: weekly analysis

Shares of International Business Machines Corporation (IBM) are trading near $243 after a muted week, as support levels become increasingly important following a stretched decline. The chart reflects mixed technical signals, highlighting ongoing uncertainty and a potential pause or reversal as the week unfolds.
 247.77
249.21
Highlights
- Shares of IBM closed at $243.38, slipping $1.56 for the week and finishing at the bottom of the recent trading range.
- The stock trades below both its 20-day and 200-day moving averages and exhibits a bearish long-term technical structure.
- IBM stock is expected to trade between $236.45 and $252.71 in the week ahead, with momentum indicators remaining mixed.
Dividend reaffirmed and downgrade from Weiss shape sentiment during the week
IBM declared a cash dividend of $1.69 per share, with the ex-dividend date set for November 10, 2026 and payment scheduled for December 10, 2026, according to GuruFocus. This announcement continues IBM's steady quarterly payout, reflecting a dividend yield of 2.7%. Weiss Ratings also downgraded IBM from 'buy' to 'hold' on October 29, 2026, as reported by The Markets Daily.
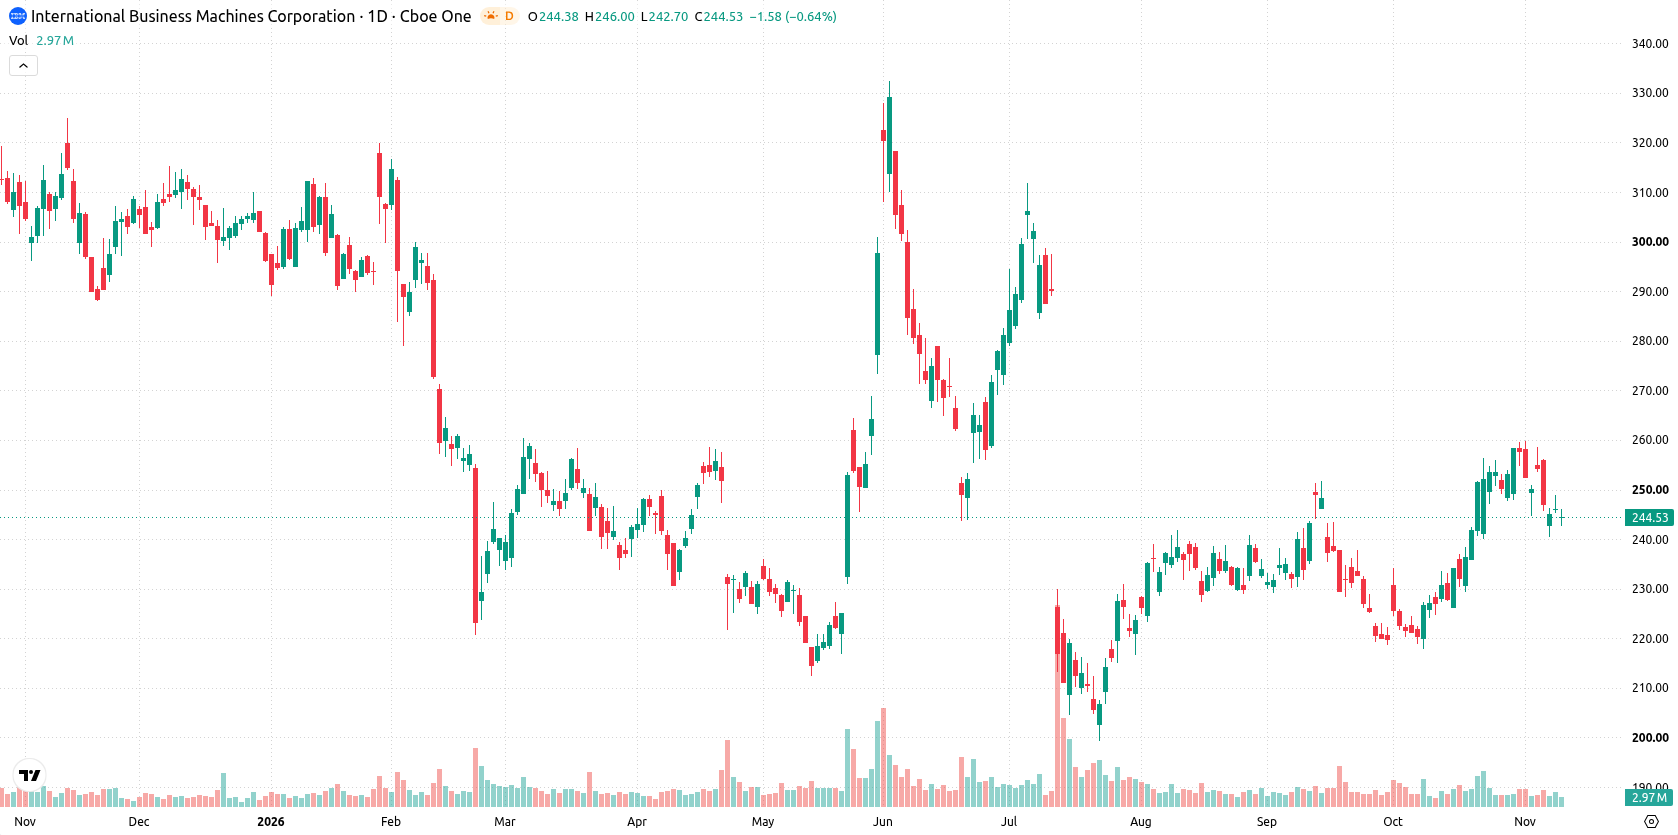
Mixed momentum signals as volatility rises and support levels grow in significance
On the daily chart, the setup signals a loss of momentum after testing the lower end of its trading range, with volatility over the past week at 6.44%. Momentum readings are mixed: while Stochastic RSI sits in oversold territory at 0, both the RSI and CCI remain neutral, pointing to a possible pause or reversal but not confirming a clear trend. MACD remains in a buy zone, but with the move lower still developing and not yet confirmed, further direction will depend on whether near-term support or resistance gives way. Immediate support is seen at $240.59, with resistance at the MA-20 level of $247.14, while the Ichimoku Kijun around $239.02 provides an additional support marker.
Range-bound outlook persists as break scenarios hinge on support and resistance
In the week ahead, IBM stock is expected to trade between $236.45 and $252.71, with a 53% probability of an increase and a 47% chance of a decrease. The base case is further ranging action inside this band, with momentum cues likely to remain mixed until a decisive break. A move above $247.14 would suggest a bullish attempt toward the upper bound, while a drop below $240.59 and the Ichimoku Kijun could open room for deeper downside within the stated range.
Earlier, analysts noted that IBM stock was staging a cautious recovery while facing key technical tests and macro-driven volatility. The current analysis adds a new dimension with a shift to mixed momentum signals and a neutral trading bias, highlighting $240.59 and $247.14 as critical levels to monitor for confirmation of a trend reversal or continuation.











-
 Afghanistan
-
 Albania
-
 Algeria
-
 Angola
-
 Argentina
-
 Armenia
-
 Australia
-
 Austria
-
 Azerbaijan
-
 Bahamas
-
 Bahrain
-
 Bangladesh
-
 Belarus
-
 Belgium
-
 Bolivia
-
 Botswana
-
 Brazil
-
 Brunei
-
 Bulgaria
-
 Cambodia
-
 Cameroon
-
 Canada
-
 Chile
-
 China
-
 Colombia
-
 Congo
-
 Costa Rica
-
 Cote d'Ivoire
-
 Croatia
-
 Cuba
-
 Cyprus
-
 Czechia
-
 DR Congo
-
 Denmark
-
 Dominican Republic
-
 Ecuador
-
 Egypt
-
 El Salvador
-
 Estonia
-
 Eswatini
-
 Ethiopia
-
 Finland
-
 France
-
 Georgia
-
 Germany
-
 Ghana
-
 Greece
-
 Haiti
-
 Hong Kong
-
 Hungary
-
 India
-
 Indonesia
-
 Iran, Islamic republic
-
 Iraq
-
 Ireland
-
 Israel
-
 Italy
-
 Jamaica
-
 Japan
-
 Jordan
-
 Kazakhstan
-
 Kenya
-
 Korea
-
 Kuwait
-
 Kyrgyzstan
-
 Laos
-
 Latvia
-
 Lebanon
-
 Lesotho
-
 Libya
-
 Lithuania
-
 Luxembourg
-
 Madagascar
-
 Malaysia
-
 Malta
-
 Mauritius
-
 Mexico
-
 Moldova
-
 Mongolia
-
 Montenegro
-
 Morocco
-
 Mozambique
-
 Myanmar
-
 Namibia
-
 Nepal
-
 Netherlands
-
 New Zealand
-
 Nigeria
-
 North Macedonia
-
 Norway
-
 Oman
-
 Pakistan
-
 Palestine
-
 Panama
-
 Papua New Guinea
-
 Paraguay
-
 Peru
-
 Philippines
-
 Poland
-
 Portugal
-
 Puerto Rico
-
 Qatar
-
 Reunion
-
 Romania
-
 Rwanda
-
 Saudi Arabia
-
 Serbia
-
 Singapore
-
 Slovakia
-
 Slovenia
-
 Somalia
-
 South Africa
-
 Spain
-
 Sri Lanka
-
 Sweden
-
 Switzerland
-
 Syria
-
 Taiwan
-
 Tajikistan
-
 Tanzania
-
 Thailand
-
 Trinidad and Tobago
-
 Tunisia
-
 Turkey
-
 UAE
-
 Uganda
-
 Ukraine
-
 United Kingdom
-
United States
-
 Uruguay
-
 Uzbekistan
-
 Venezuela
-
 Vietnam
-
 Yemen
-
 Zambia
-
 Zimbabwe
- Forex
- Crypto












