

ETF repositioning coincides with Intel stock moving higher amid volatile trading

Intel (INTC) stock is trading at $61.56, having risen 5.97% during the session and holding near the day's high in a volatile market. The price stands above its key short- and medium-term moving averages, indicating resilient intraday momentum.
 61.33
64.04
Highlights
- Shares of Intel saw a net $212.2 million outflow from ETFs, with SOXX reducing its allocation by over 10%.
- Large institutional investors made significant changes to Intel holdings in Q3, indicating a wide range of outlooks and increased share turnover.
- Intel stock trades at $61.56, up 5.97% today with mixed technical signals and is expected to range between $57.73 and $65.37 over the next several days.
ETF outflows and institutional rotation drive turnover and volatility
A major driver of recent market dynamics for Intel is the substantial $212.2 million net outflow from ETFs, led by the SOXX ETF reducing its Intel allocation by over 10%, according to Yahoo Finance. This large-scale repositioning by passive investment vehicles has directly influenced liquidity and may provoke short-term volatility as shares are absorbed by other market participants. Meanwhile, institutional investors reported significant changes to their holdings in the third quarter, with some sharply increasing and others reducing their stakes, highlighting divergent outlooks and adding to recent share turnover.
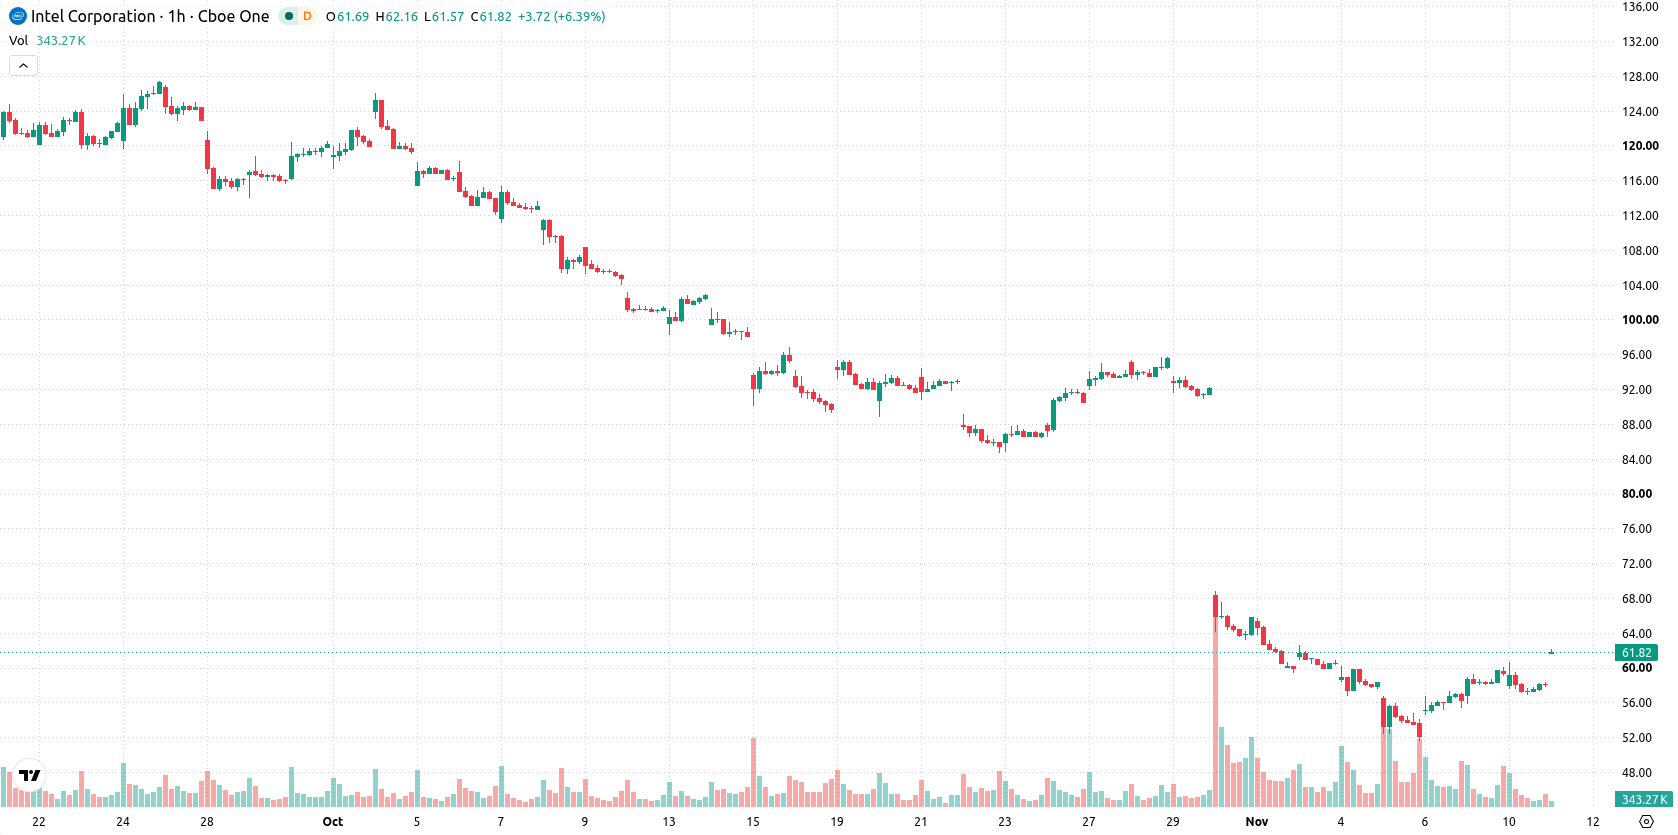
Mixed technical signals as key resistance caps medium-term momentum
On the hourly chart, INTC is positioned above both the MA-20 and MA-50, suggesting short- and medium-term bullish momentum, while remaining below the MA-200, which continues to act as resistance. The Ichimoku Kijun level at $56.22 provides immediate support for the stock. Technical indicators present a mixed picture: MACD issues a strong sell signal, with ADX registering neutral. RSI, Stoch RSI, and CCI are all in neutral ranges, indicating neither overbought nor oversold conditions. Bull/Bear Power is slightly positive at 0.25, underscoring mild buyer dominance intraday.
Range-bound outlook as breakout potential contends with downside risk
Over the next several days, trading is expected to remain within a $57.73 to $65.37 range, reflecting typical volatility relative to current levels. The probability of a move lower stands at 53%, while the chance of an upward breakout is 47%. The most likely scenario is for INTC to consolidate within this corridor; however, a sustained break above resistance could prompt further gains, while a drop below $57.73 support may increase downside risk.
Earlier, analysts noted that despite advances in industrial AI partnerships, Intel shares remained under downside pressure with technical vulnerabilities. The current article adds a new dimension by highlighting that significant ETF outflows and institutional repositioning are now contributing to heightened share turnover, making the $57.73 support level a key threshold to monitor for increased downside risk in the days ahead.










-
 Afghanistan
-
 Albania
-
 Algeria
-
 Angola
-
 Argentina
-
 Armenia
-
 Australia
-
 Austria
-
 Azerbaijan
-
 Bahamas
-
 Bahrain
-
 Bangladesh
-
 Belarus
-
 Belgium
-
 Bolivia
-
 Botswana
-
 Brazil
-
 Brunei
-
 Bulgaria
-
 Cambodia
-
 Cameroon
-
 Canada
-
 Chile
-
 China
-
 Colombia
-
 Congo
-
 Costa Rica
-
 Cote d'Ivoire
-
 Croatia
-
 Cuba
-
 Cyprus
-
 Czechia
-
 DR Congo
-
 Denmark
-
 Dominican Republic
-
 Ecuador
-
 Egypt
-
 El Salvador
-
 Estonia
-
 Eswatini
-
 Ethiopia
-
 Finland
-
 France
-
 Georgia
-
 Germany
-
 Ghana
-
 Greece
-
 Haiti
-
 Hong Kong
-
 Hungary
-
 India
-
 Indonesia
-
 Iran, Islamic republic
-
 Iraq
-
 Ireland
-
 Israel
-
 Italy
-
 Jamaica
-
 Japan
-
 Jordan
-
 Kazakhstan
-
 Kenya
-
 Korea
-
 Kuwait
-
 Kyrgyzstan
-
 Laos
-
 Latvia
-
 Lebanon
-
 Lesotho
-
 Libya
-
 Lithuania
-
 Luxembourg
-
 Madagascar
-
 Malaysia
-
 Malta
-
 Mauritius
-
 Mexico
-
 Moldova
-
 Mongolia
-
 Montenegro
-
 Morocco
-
 Mozambique
-
 Myanmar
-
 Namibia
-
 Nepal
-
 Netherlands
-
 New Zealand
-
 Nigeria
-
 North Macedonia
-
 Norway
-
 Oman
-
 Pakistan
-
 Palestine
-
 Panama
-
 Papua New Guinea
-
 Paraguay
-
 Peru
-
 Philippines
-
 Poland
-
 Portugal
-
 Puerto Rico
-
 Qatar
-
 Reunion
-
 Romania
-
 Rwanda
-
 Saudi Arabia
-
 Serbia
-
 Singapore
-
 Slovakia
-
 Slovenia
-
 Somalia
-
 South Africa
-
 Spain
-
 Sri Lanka
-
 Sweden
-
 Switzerland
-
 Syria
-
 Taiwan
-
 Tajikistan
-
 Tanzania
-
 Thailand
-
 Trinidad and Tobago
-
 Tunisia
-
 Turkey
-
 UAE
-
 Uganda
-
 Ukraine
-
 United Kingdom
-
United States
-
 Uruguay
-
 Uzbekistan
-
 Venezuela
-
 Vietnam
-
 Yemen
-
 Zambia
-
 Zimbabwe
- Forex
- Crypto












