

What's behind Celanese's latest 3.9% stock surge?

Celanese Corporation (CE) surged 3.94% today on strong technical momentum and persistent intraday buying pressure. The move is supported by the stock trading above its 20- and 50-day moving averages, even as longer-term resistance near the 200-day average caps upside potential.
 51.60
52.19
Highlights
- Celanese stock is showing sustained short- and medium-term momentum with shares currently near session highs after a 3.94% gain.
- Momentum indicators are constructive overall, with strong buy signals from MACD and buyers dominating intraday action, but trend strength remains neutral.
- The stock is forecast to trade in a $48.26 to $53.5 range over the next five sessions, with a break above $51.46 likely to confirm a bullish scenario.
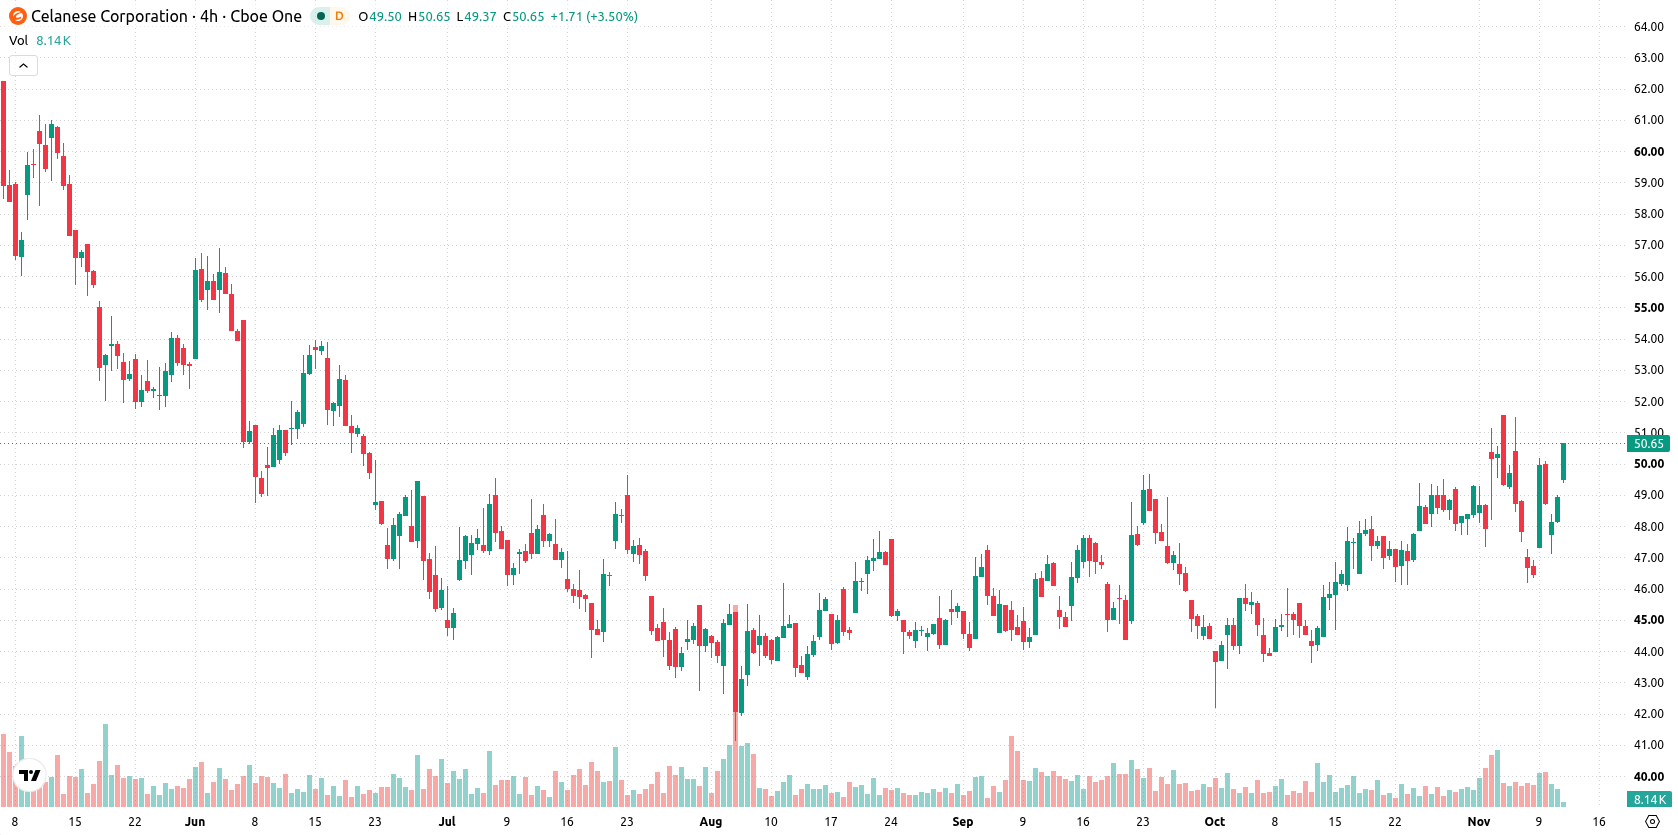
Short-term momentum persists as long-term resistance limits upside
Celanese is trading above its 20-day and 50-day moving averages at $48.03 and $46.5, respectively, but remains just below the 200-day at $51.65. This alignment signals ongoing short- and medium-term momentum, though longer-term pressure from the 50- and 200-day averages persists. Immediate resistance stands at the week high of $51.46, with support at today's high of $48.95. The MACD is positive and signals strong buy momentum, while the ADX is neutral and demonstrates no dominant trend strength. The RSI, Stochastic RSI, and CCI are all neutral, with no extreme conditions present. Bull/Bear Power is positive, evidencing buyers’ dominance intraday, as the Awesome Oscillator remains neutral. The stock climbed $1.93 after opening with a downside gap, and intraday volatility was high at 4.13%, with persistent strength toward the upper end of today's range.
Earlier, analysts noted that Celanese was demonstrating short- and medium-term momentum while remaining constrained by longer-term technical resistance. The latest trading reinforces this pattern and, with volatility elevated, traders should watch for a potential breakout above $51.46 as a signal for a sustained directional move.






Latest Celanese Corporation News




-
 Afghanistan
-
 Albania
-
 Algeria
-
 Angola
-
 Argentina
-
 Armenia
-
 Australia
-
 Austria
-
 Azerbaijan
-
 Bahamas
-
 Bahrain
-
 Bangladesh
-
 Belarus
-
 Belgium
-
 Bolivia
-
 Botswana
-
 Brazil
-
 Brunei
-
 Bulgaria
-
 Cambodia
-
 Cameroon
-
 Canada
-
 Chile
-
 China
-
 Colombia
-
 Congo
-
 Costa Rica
-
 Cote d'Ivoire
-
 Croatia
-
 Cuba
-
 Cyprus
-
 Czechia
-
 DR Congo
-
 Denmark
-
 Dominican Republic
-
 Ecuador
-
 Egypt
-
 El Salvador
-
 Estonia
-
 Eswatini
-
 Ethiopia
-
 Finland
-
 France
-
 Georgia
-
 Germany
-
 Ghana
-
 Greece
-
 Haiti
-
 Hong Kong
-
 Hungary
-
 India
-
 Indonesia
-
 Iran, Islamic republic
-
 Iraq
-
 Ireland
-
 Israel
-
 Italy
-
 Jamaica
-
 Japan
-
 Jordan
-
 Kazakhstan
-
 Kenya
-
 Korea
-
 Kuwait
-
 Kyrgyzstan
-
 Laos
-
 Latvia
-
 Lebanon
-
 Lesotho
-
 Libya
-
 Lithuania
-
 Luxembourg
-
 Madagascar
-
 Malaysia
-
 Malta
-
 Mauritius
-
 Mexico
-
 Moldova
-
 Mongolia
-
 Montenegro
-
 Morocco
-
 Mozambique
-
 Myanmar
-
 Namibia
-
 Nepal
-
 Netherlands
-
 New Zealand
-
 Nigeria
-
 North Macedonia
-
 Norway
-
 Oman
-
 Pakistan
-
 Palestine
-
 Panama
-
 Papua New Guinea
-
 Paraguay
-
 Peru
-
 Philippines
-
 Poland
-
 Portugal
-
 Puerto Rico
-
 Qatar
-
 Reunion
-
 Romania
-
 Rwanda
-
 Saudi Arabia
-
 Serbia
-
 Singapore
-
 Slovakia
-
 Slovenia
-
 Somalia
-
 South Africa
-
 Spain
-
 Sri Lanka
-
 Sweden
-
 Switzerland
-
 Syria
-
 Taiwan
-
 Tajikistan
-
 Tanzania
-
 Thailand
-
 Trinidad and Tobago
-
 Tunisia
-
 Turkey
-
 UAE
-
 Uganda
-
 Ukraine
-
 United Kingdom
-
United States
-
 Uruguay
-
 Uzbekistan
-
 Venezuela
-
 Vietnam
-
 Yemen
-
 Zambia
-
 Zimbabwe
- Forex
- Crypto












