

Why is Summit Therapeutics stock down 4.7% today?

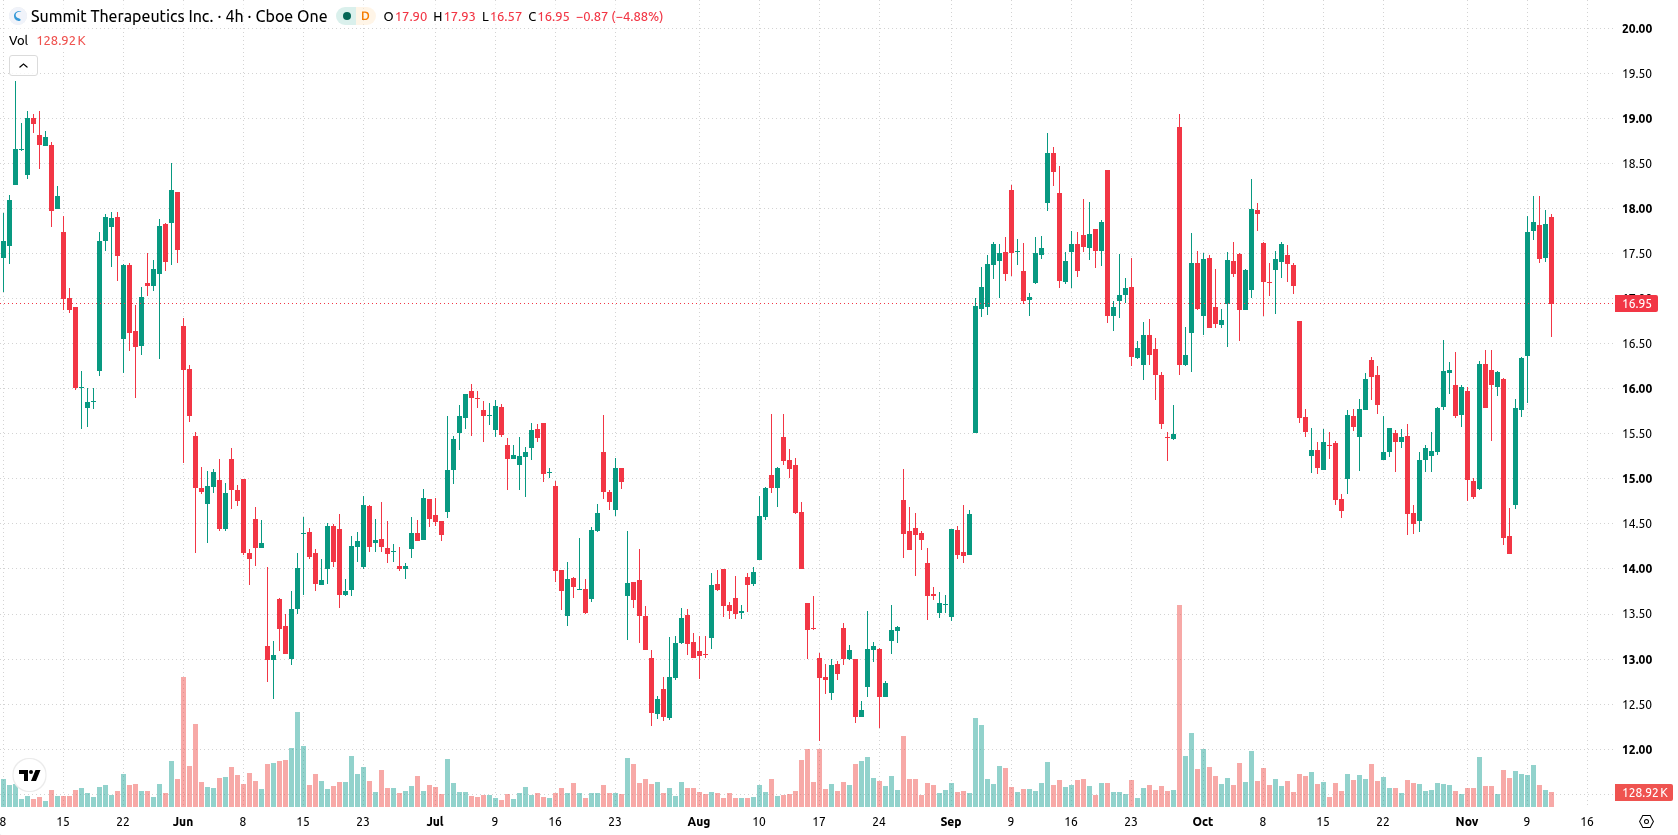
Summit Therapeutics Inc. (SMMT) fell 4.77% today, pressured by intraday volatility and mixed momentum signals. This downside move contradicts the prevailing bullish trend structure, with prices holding above all major moving averages.
 15.03
18.13
Highlights
- Summit Therapeutics stock trades above key short-, medium-, and long-term moving averages, indicating a prevailing bullish trend.
- Technical indicators show mixed momentum, with MACD and ADX neutral but Stochastic RSI and CCI signaling overbought conditions and potential overheating risk.
- Shares moved down 4.77% today with elevated intraday volatility of 8.09%, and the expected five-day range is $15 to $18.96.
Overbought momentum outweighs neutral indicators as uptrend persists
Summit Therapeutics is trading above its 20-day, 50-day, and 200-day moving averages ($15.73, $16.41, and $16.15), suggesting a bullish bias across multiple time frames. The nearest support is at $16.57 with resistance at the session's high of $17.91, while the Ichimoku Kijun at $16.24 remains below the price, confirming the underlying uptrend. Momentum signals are mixed; both MACD and ADX are neutral, and the RSI remains neutral as well. However, the Stochastic RSI and CCI are in the overbought zone, indicating a risk of overheating. Bull/Bear Power (BBP) is positive, with buyers dominating intraday, and the Awesome Oscillator signals a strong buy direction. The stock declined $0.85 from the open and is close to the session's low, reflecting notable intraday volatility of 8.09%. The market is experiencing a pullback, which contrasts with the overbought readings in Stochastic RSI and CCI.
Earlier, analysts noted that Summit Therapeutics was under sustained technical pressure and displayed limited signs of recovery. The current breakout above major moving averages signifies a constructive shift in trend structure, with the next critical test for momentum coming at the $17.91 resistance level.






Latest Summit Therapeutics News




-
 Afghanistan
-
 Albania
-
 Algeria
-
 Angola
-
 Argentina
-
 Armenia
-
 Australia
-
 Austria
-
 Azerbaijan
-
 Bahamas
-
 Bahrain
-
 Bangladesh
-
 Belarus
-
 Belgium
-
 Bolivia
-
 Botswana
-
 Brazil
-
 Brunei
-
 Bulgaria
-
 Cambodia
-
 Cameroon
-
 Canada
-
 Chile
-
 China
-
 Colombia
-
 Congo
-
 Costa Rica
-
 Cote d'Ivoire
-
 Croatia
-
 Cuba
-
 Cyprus
-
 Czechia
-
 DR Congo
-
 Denmark
-
 Dominican Republic
-
 Ecuador
-
 Egypt
-
 El Salvador
-
 Estonia
-
 Eswatini
-
 Ethiopia
-
 Finland
-
 France
-
 Georgia
-
 Germany
-
 Ghana
-
 Greece
-
 Haiti
-
 Hong Kong
-
 Hungary
-
 India
-
 Indonesia
-
 Iran, Islamic republic
-
 Iraq
-
 Ireland
-
 Israel
-
 Italy
-
 Jamaica
-
 Japan
-
 Jordan
-
 Kazakhstan
-
 Kenya
-
 Korea
-
 Kuwait
-
 Kyrgyzstan
-
 Laos
-
 Latvia
-
 Lebanon
-
 Lesotho
-
 Libya
-
 Lithuania
-
 Luxembourg
-
 Madagascar
-
 Malaysia
-
 Malta
-
 Mauritius
-
 Mexico
-
 Moldova
-
 Mongolia
-
 Montenegro
-
 Morocco
-
 Mozambique
-
 Myanmar
-
 Namibia
-
 Nepal
-
 Netherlands
-
 New Zealand
-
 Nigeria
-
 North Macedonia
-
 Norway
-
 Oman
-
 Pakistan
-
 Palestine
-
 Panama
-
 Papua New Guinea
-
 Paraguay
-
 Peru
-
 Philippines
-
 Poland
-
 Portugal
-
 Puerto Rico
-
 Qatar
-
 Reunion
-
 Romania
-
 Rwanda
-
 Saudi Arabia
-
 Serbia
-
 Singapore
-
 Slovakia
-
 Slovenia
-
 Somalia
-
 South Africa
-
 Spain
-
 Sri Lanka
-
 Sweden
-
 Switzerland
-
 Syria
-
 Taiwan
-
 Tajikistan
-
 Tanzania
-
 Thailand
-
 Trinidad and Tobago
-
 Tunisia
-
 Turkey
-
 UAE
-
 Uganda
-
 Ukraine
-
 United Kingdom
-
United States
-
 Uruguay
-
 Uzbekistan
-
 Venezuela
-
 Vietnam
-
 Yemen
-
 Zambia
-
 Zimbabwe
- Forex
- Crypto












