

Will ServiceNow stock challenge $107.43 resistance amid expanded AI partnerships?

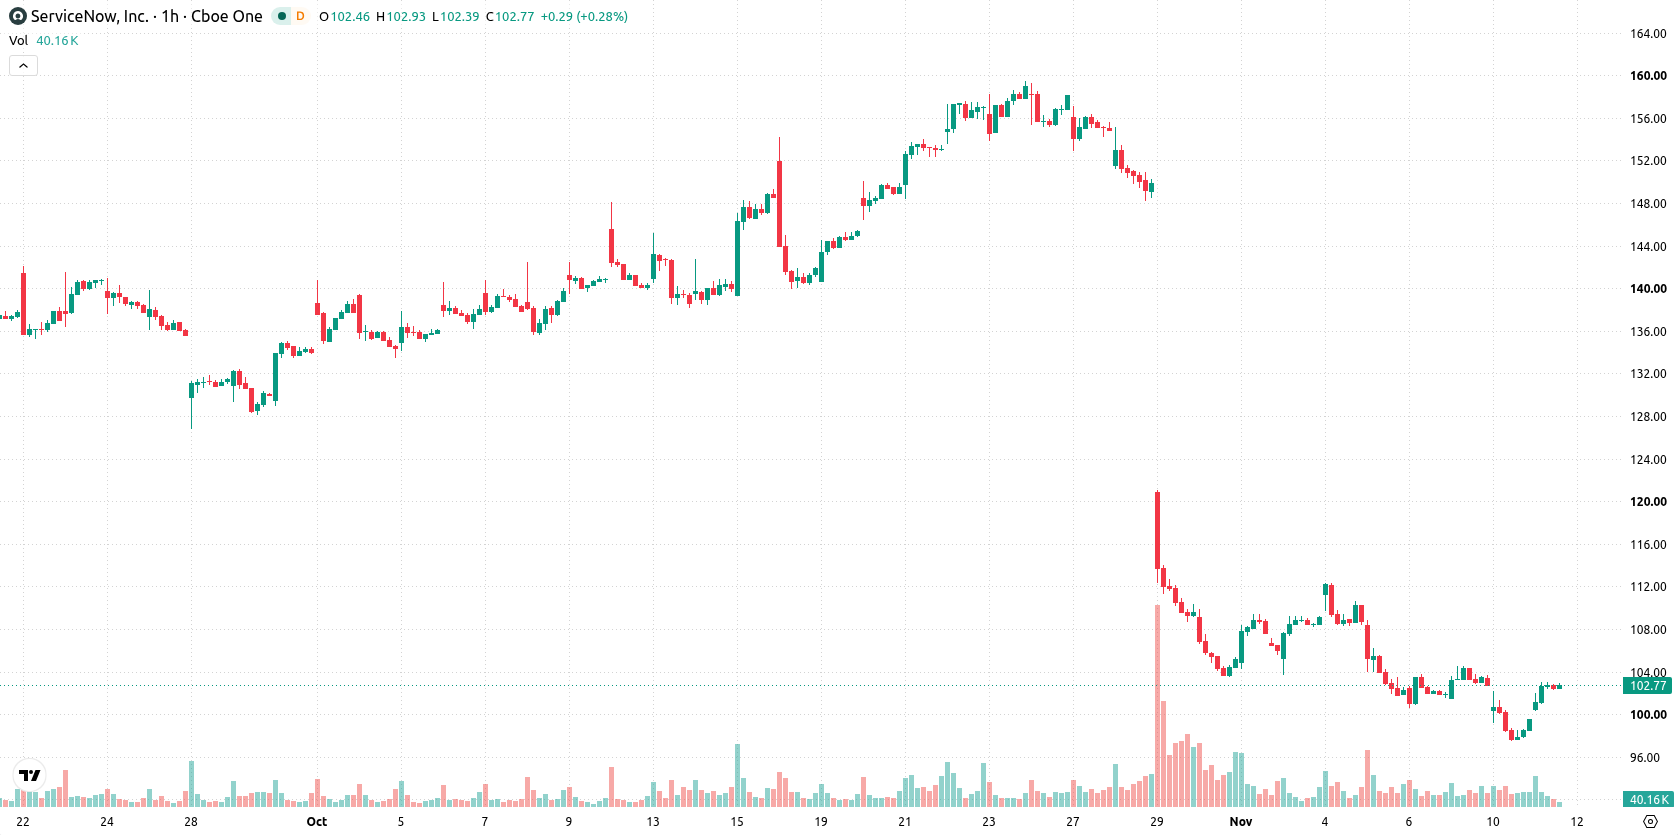
ServiceNow (NOW) stock is trading at $102.69, up 3.11% on the day after starting with a 0.95 gap up and reaching near its session high. The stock is currently above its short-term moving average but remains below intermediate and long-term averages, indicating a mixed technical landscape.
 102.86
104.47
Highlights
- ServiceNow reported third-quarter revenue of $4.11 billion, up 20.5% year over year, but missed adjusted EPS consensus.
- Acquisition expenses reduced GAAP operating margin to 9.5%, pressuring profitability and ending a streak of six consecutive beats.
- NOW/USD rose 3.11% to $102.69 but remains under long-term technical resistance, with a 2 to 3 day range expected between $97.95 and $107.43 as short-term buying faces broader selling pressure.
Profitability pressured as revenue growth meets margin drag, AI expansion
ServiceNow posted third-quarter revenue of $4.11 billion, up 20.5% year over year, while adjusted earnings per share missed consensus and ended a streak of six consecutive beats, according to Investing.com. Acquisition expenses reduced its GAAP operating margin to 9.5%, weighing on profitability and partially offsetting top-line growth, as reported by Yahoo Finance. Meanwhile, ServiceNow has expanded its enterprise AI presence through a partnership with LTM, with 1,500 AI agents deployed and plans to reach over 700 shared customers, and Kyndryl’s launch of Autonomous Operations for ServiceNow on the ServiceNow Store marks further growth in ecosystem partnerships, both highlighted by Yahoo Finance. These developments reflect ongoing strategic investment and platform expansion, providing a foundation for long-term positioning.
Seller dominance as momentum falters below key moving averages
NOW is trading above the MA-20 but below the MA-50 on the hourly chart, while remaining significantly under the MA-200 on the daily timeframe. The Ichimoku Kijun currently sits at $101.51, serving as immediate support. Momentum indicators reveal both MACD and ADX signaling selling pressure, and all three key oscillators—RSI, Stochastic RSI, and CCI—are confirmed within their respective neutral zones. Bull/Bear Power remains negative, indicating seller dominance in intraday momentum.
Downside risk prevails as consolidation and volatility guide outlook
Over the next two to three trading days, NOW is expected to fluctuate between $97.95 and $107.43, a range consistent with typical volatility for the period. The probability of an upward breakout stands at 43%, while a downward move is more likely at 57%. The baseline scenario sees price consolidating in a short-term sideways corridor, but a sustained move above the upper bound could trigger additional gains, while a decisive break below immediate support would risk a deeper pullback.
Previously it was reported that ServiceNow maintained a bearish technical structure despite new platform partnerships and innovation initiatives. The current analysis adds a new dimension with improving short-term signals, but sustained selling pressure and neutral momentum indicators suggest that traders should focus on the $97.95 to $107.43 range as the prevailing scenario.






Latest ServiceNow News




-
 Afghanistan
-
 Albania
-
 Algeria
-
 Angola
-
 Argentina
-
 Armenia
-
 Australia
-
 Austria
-
 Azerbaijan
-
 Bahamas
-
 Bahrain
-
 Bangladesh
-
 Belarus
-
 Belgium
-
 Bolivia
-
 Botswana
-
 Brazil
-
 Brunei
-
 Bulgaria
-
 Cambodia
-
 Cameroon
-
 Canada
-
 Chile
-
 China
-
 Colombia
-
 Congo
-
 Costa Rica
-
 Cote d'Ivoire
-
 Croatia
-
 Cuba
-
 Cyprus
-
 Czechia
-
 DR Congo
-
 Denmark
-
 Dominican Republic
-
 Ecuador
-
 Egypt
-
 El Salvador
-
 Estonia
-
 Eswatini
-
 Ethiopia
-
 Finland
-
 France
-
 Georgia
-
 Germany
-
 Ghana
-
 Greece
-
 Haiti
-
 Hong Kong
-
 Hungary
-
 India
-
 Indonesia
-
 Iran, Islamic republic
-
 Iraq
-
 Ireland
-
 Israel
-
 Italy
-
 Jamaica
-
 Japan
-
 Jordan
-
 Kazakhstan
-
 Kenya
-
 Korea
-
 Kuwait
-
 Kyrgyzstan
-
 Laos
-
 Latvia
-
 Lebanon
-
 Lesotho
-
 Libya
-
 Lithuania
-
 Luxembourg
-
 Madagascar
-
 Malaysia
-
 Malta
-
 Mauritius
-
 Mexico
-
 Moldova
-
 Mongolia
-
 Montenegro
-
 Morocco
-
 Mozambique
-
 Myanmar
-
 Namibia
-
 Nepal
-
 Netherlands
-
 New Zealand
-
 Nigeria
-
 North Macedonia
-
 Norway
-
 Oman
-
 Pakistan
-
 Palestine
-
 Panama
-
 Papua New Guinea
-
 Paraguay
-
 Peru
-
 Philippines
-
 Poland
-
 Portugal
-
 Puerto Rico
-
 Qatar
-
 Reunion
-
 Romania
-
 Rwanda
-
 Saudi Arabia
-
 Serbia
-
 Singapore
-
 Slovakia
-
 Slovenia
-
 Somalia
-
 South Africa
-
 Spain
-
 Sri Lanka
-
 Sweden
-
 Switzerland
-
 Syria
-
 Taiwan
-
 Tajikistan
-
 Tanzania
-
 Thailand
-
 Trinidad and Tobago
-
 Tunisia
-
 Turkey
-
 UAE
-
 Uganda
-
 Ukraine
-
 United Kingdom
-
United States
-
 Uruguay
-
 Uzbekistan
-
 Venezuela
-
 Vietnam
-
 Yemen
-
 Zambia
-
 Zimbabwe
- Forex
- Crypto












