


Match Group, Inc. (MTCH) gained 3.77% today, driven by short-term momentum as the stock opened higher and remained strong throughout the session. The recovery looks limited, however, with price action still capped below the 20-day and 50-day moving averages and broader momentum indicators signaling caution.
 42.47
42.47
Highlights
- Shares of Match Group trade below short- and medium-term moving averages but remain above long-term support, indicating mixed trend signals.
- Momentum indicators including MACD, ADX and Awesome Oscillator currently lean bearish, with no overbought or oversold extremes shown by RSI and related signals.
- Match Group stock is forecast to trade between $40.46 to $42.32 over the next five days with a 68% probability of a downward move.
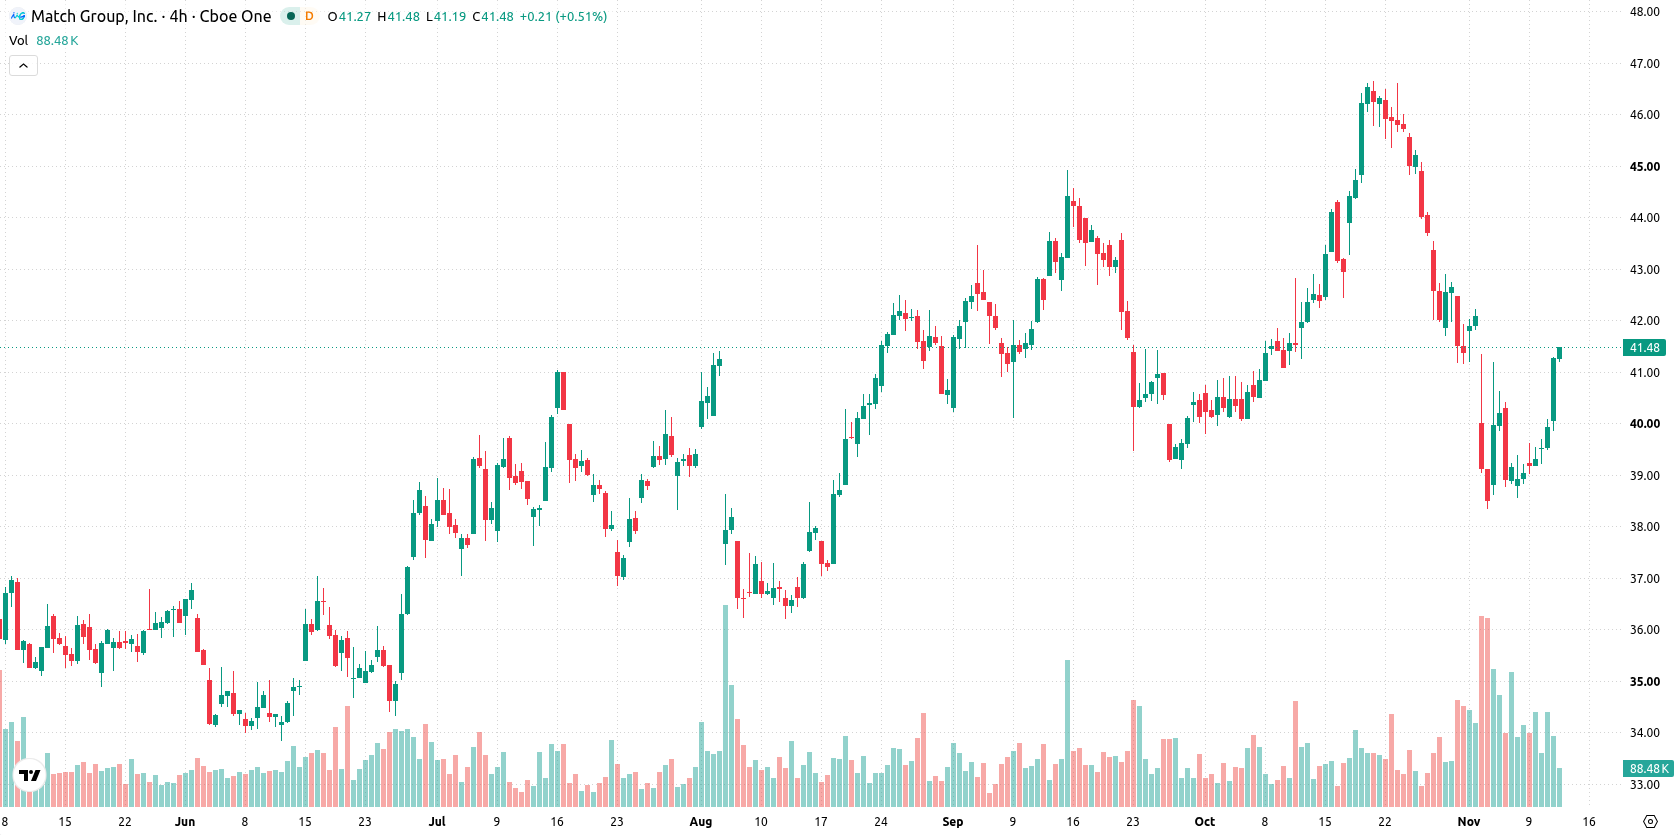
Near-term resistance as momentum indicators signal underlying weakness
MTCH is trading below both its 20-day and 50-day moving averages, which are set at $42.58 and $42 respectively, while staying above the 200-day moving average at $36.84. This positions the stock under short- and medium-term selling pressure within a generally bullish long-term structure. The 50-day average near $42 signals overhead resistance, with $41.22 marking today's intraday high and acting as the immediate support. Momentum indicators carry a bearish bias: MACD and ADX reflect continued selling pressure and sellers dominate intraday flow per BBP. The RSI, Stochastic RSI, and CCI are all neutral, showing no overbought or oversold conditions. The Awesome Oscillator also suggests a tilt toward selling. Volatility for the day was 3.31%, and the stock finished near its session highs.
Previously it was reported that artificial intelligence initiatives contributed to a rebound in Tinder's U.S. daily active users. In the current technical setup, a break above the $42 resistance would suggest upside potential, while failure to hold $41.22 may open the way for renewed selling within the identified volatility band.






Latest Match Group News





-
 Afghanistan
-
 Albania
-
 Algeria
-
 Angola
-
 Argentina
-
 Armenia
-
 Australia
-
 Austria
-
 Azerbaijan
-
 Bahamas
-
 Bahrain
-
 Bangladesh
-
 Belarus
-
 Belgium
-
 Bolivia
-
 Botswana
-
 Brazil
-
 Brunei
-
 Bulgaria
-
 Cambodia
-
 Cameroon
-
 Canada
-
 Chile
-
 China
-
 Colombia
-
 Congo
-
 Costa Rica
-
 Cote d'Ivoire
-
 Croatia
-
 Cuba
-
 Cyprus
-
 Czechia
-
 DR Congo
-
 Denmark
-
 Dominican Republic
-
 Ecuador
-
 Egypt
-
 El Salvador
-
 Estonia
-
 Eswatini
-
 Ethiopia
-
 Finland
-
 France
-
 Georgia
-
 Germany
-
 Ghana
-
 Greece
-
 Haiti
-
 Hong Kong
-
 Hungary
-
 India
-
 Indonesia
-
 Iran, Islamic republic
-
 Iraq
-
 Ireland
-
 Israel
-
 Italy
-
 Jamaica
-
 Japan
-
 Jordan
-
 Kazakhstan
-
 Kenya
-
 Korea
-
 Kuwait
-
 Kyrgyzstan
-
 Laos
-
 Latvia
-
 Lebanon
-
 Lesotho
-
 Libya
-
 Lithuania
-
 Luxembourg
-
 Madagascar
-
 Malaysia
-
 Malta
-
 Mauritius
-
 Mexico
-
 Moldova
-
 Mongolia
-
 Montenegro
-
 Morocco
-
 Mozambique
-
 Myanmar
-
 Namibia
-
 Nepal
-
 Netherlands
-
 New Zealand
-
 Nigeria
-
 North Macedonia
-
 Norway
-
 Oman
-
 Pakistan
-
 Palestine
-
 Panama
-
 Papua New Guinea
-
 Paraguay
-
 Peru
-
 Philippines
-
 Poland
-
 Portugal
-
 Puerto Rico
-
 Qatar
-
 Reunion
-
 Romania
-
 Rwanda
-
 Saudi Arabia
-
 Serbia
-
 Singapore
-
 Slovakia
-
 Slovenia
-
 Somalia
-
 South Africa
-
 Spain
-
 Sri Lanka
-
 Sweden
-
 Switzerland
-
 Syria
-
 Taiwan
-
 Tajikistan
-
 Tanzania
-
 Thailand
-
 Trinidad and Tobago
-
 Tunisia
-
 Turkey
-
 UAE
-
 Uganda
-
 Ukraine
-
 United Kingdom
-
United States
-
 Uruguay
-
 Uzbekistan
-
 Venezuela
-
 Vietnam
-
 Yemen
-
 Zambia
-
 Zimbabwe
- Forex
- Crypto












