

BP rallies as traders capitalize on sustained bullish trend

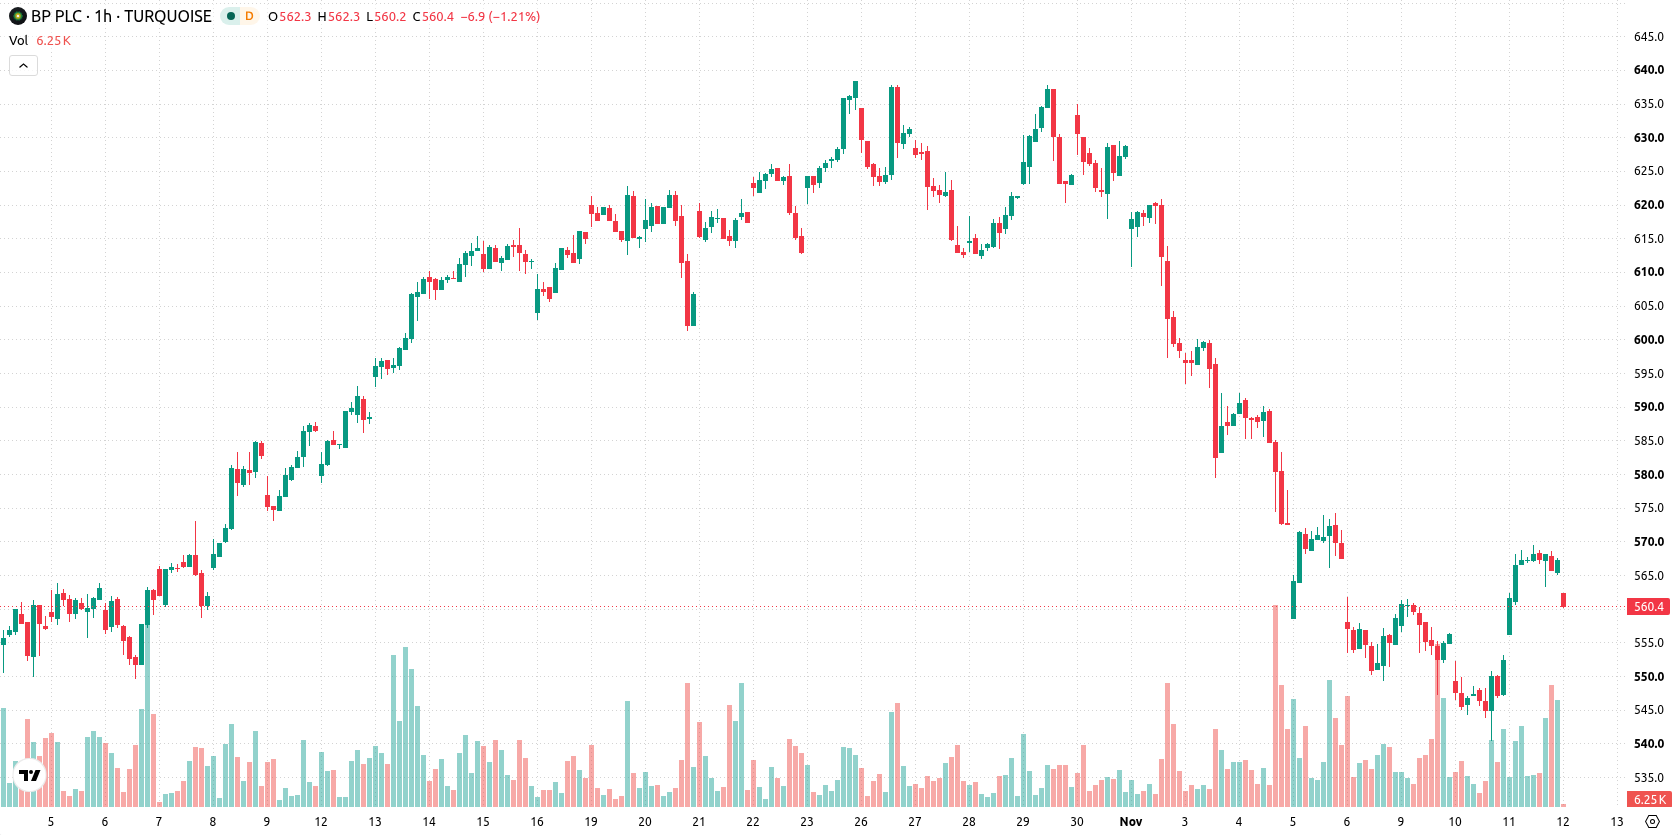
BP (BP) stock is trading at GBX567.1, up 2.7% on the day. The price currently sits above its key moving averages, maintaining a bullish orientation in the short and medium term.
 576.30
Highlights
- BP/GBX stock trades above short, medium, and long-term moving averages, indicating a bullish trend across timeframes.
- Momentum indicators remain net positive with buyers dominating, though overbought oscillators indicate near-term overheating risk.
- Shares rose 2.7% to GBX567.1 with expected price action between GBX551.81 and GBX582.39 and a 60% probability of further upside.
Strong momentum and overbought signal as buyers retain control
BP is trading above the MA-20 and MA-50 on its hourly chart, with price also above the MA-200 on the daily timeframe. The Ichimoku Kijun provides immediate support at GBX554.9. Momentum indicators remain in buyers' favor, with both MACD and ADX signaling ongoing control. RSI and CCI are neutral, while Stochastic RSI is in the overbought zone, introducing near-term overheating risk. Bull/Bear Power is positive at 4.82, reflecting intraday buyer dominance. Despite strong upward momentum, Stochastic RSI's overbought condition highlights that the recent surge may be extended.
Price consolidation expected as upside bias meets volatility band
Looking ahead to the next few sessions, BP is expected to fluctuate between GBX551.81 and GBX582.39, reflecting a typical volatility band relative to current levels. There is a 60% probability of continued upside versus a 40% chance of downward movement. A baseline scenario envisions price consolidation within this range. A decisive break above the upper boundary would suggest a bullish extension, while a failure of support at the lower limit could prompt a bearish reversal.
Earlier, analysts noted that BP was experiencing sustained bearish momentum with a risk of further downside, driven by mixed technical signals. The current technical setup, reflecting a notable shift to bullish momentum, points to a prevailing scenario in which traders should closely monitor price action around the stated volatility band for signs of either consolidation or renewed directional movement.






Latest BP News





-
 Afghanistan
-
 Albania
-
 Algeria
-
 Angola
-
 Argentina
-
 Armenia
-
 Australia
-
 Austria
-
 Azerbaijan
-
 Bahamas
-
 Bahrain
-
 Bangladesh
-
 Belarus
-
 Belgium
-
 Bolivia
-
 Botswana
-
 Brazil
-
 Brunei
-
 Bulgaria
-
 Cambodia
-
 Cameroon
-
 Canada
-
 Chile
-
 China
-
 Colombia
-
 Congo
-
 Costa Rica
-
 Cote d'Ivoire
-
 Croatia
-
 Cuba
-
 Cyprus
-
 Czechia
-
 DR Congo
-
 Denmark
-
 Dominican Republic
-
 Ecuador
-
 Egypt
-
 El Salvador
-
 Estonia
-
 Eswatini
-
 Ethiopia
-
 Finland
-
 France
-
 Georgia
-
 Germany
-
 Ghana
-
 Greece
-
 Haiti
-
 Hong Kong
-
 Hungary
-
 India
-
 Indonesia
-
 Iran, Islamic republic
-
 Iraq
-
 Ireland
-
 Israel
-
 Italy
-
 Jamaica
-
 Japan
-
 Jordan
-
 Kazakhstan
-
 Kenya
-
 Korea
-
 Kuwait
-
 Kyrgyzstan
-
 Laos
-
 Latvia
-
 Lebanon
-
 Lesotho
-
 Libya
-
 Lithuania
-
 Luxembourg
-
 Madagascar
-
 Malaysia
-
 Malta
-
 Mauritius
-
 Mexico
-
 Moldova
-
 Mongolia
-
 Montenegro
-
 Morocco
-
 Mozambique
-
 Myanmar
-
 Namibia
-
 Nepal
-
 Netherlands
-
 New Zealand
-
 Nigeria
-
 North Macedonia
-
 Norway
-
 Oman
-
 Pakistan
-
 Palestine
-
 Panama
-
 Papua New Guinea
-
 Paraguay
-
 Peru
-
 Philippines
-
 Poland
-
 Portugal
-
 Puerto Rico
-
 Qatar
-
 Reunion
-
 Romania
-
 Rwanda
-
 Saudi Arabia
-
 Serbia
-
 Singapore
-
 Slovakia
-
 Slovenia
-
 Somalia
-
 South Africa
-
 Spain
-
 Sri Lanka
-
 Sweden
-
 Switzerland
-
 Syria
-
 Taiwan
-
 Tajikistan
-
 Tanzania
-
 Thailand
-
 Trinidad and Tobago
-
 Tunisia
-
 Turkey
-
 UAE
-
 Uganda
-
 Ukraine
-
 United Kingdom
-
United States
-
 Uruguay
-
 Uzbekistan
-
 Venezuela
-
 Vietnam
-
 Yemen
-
 Zambia
-
 Zimbabwe
- Forex
- Crypto












