

Will ASTS break higher as upward price move attracts bullish sentiment?

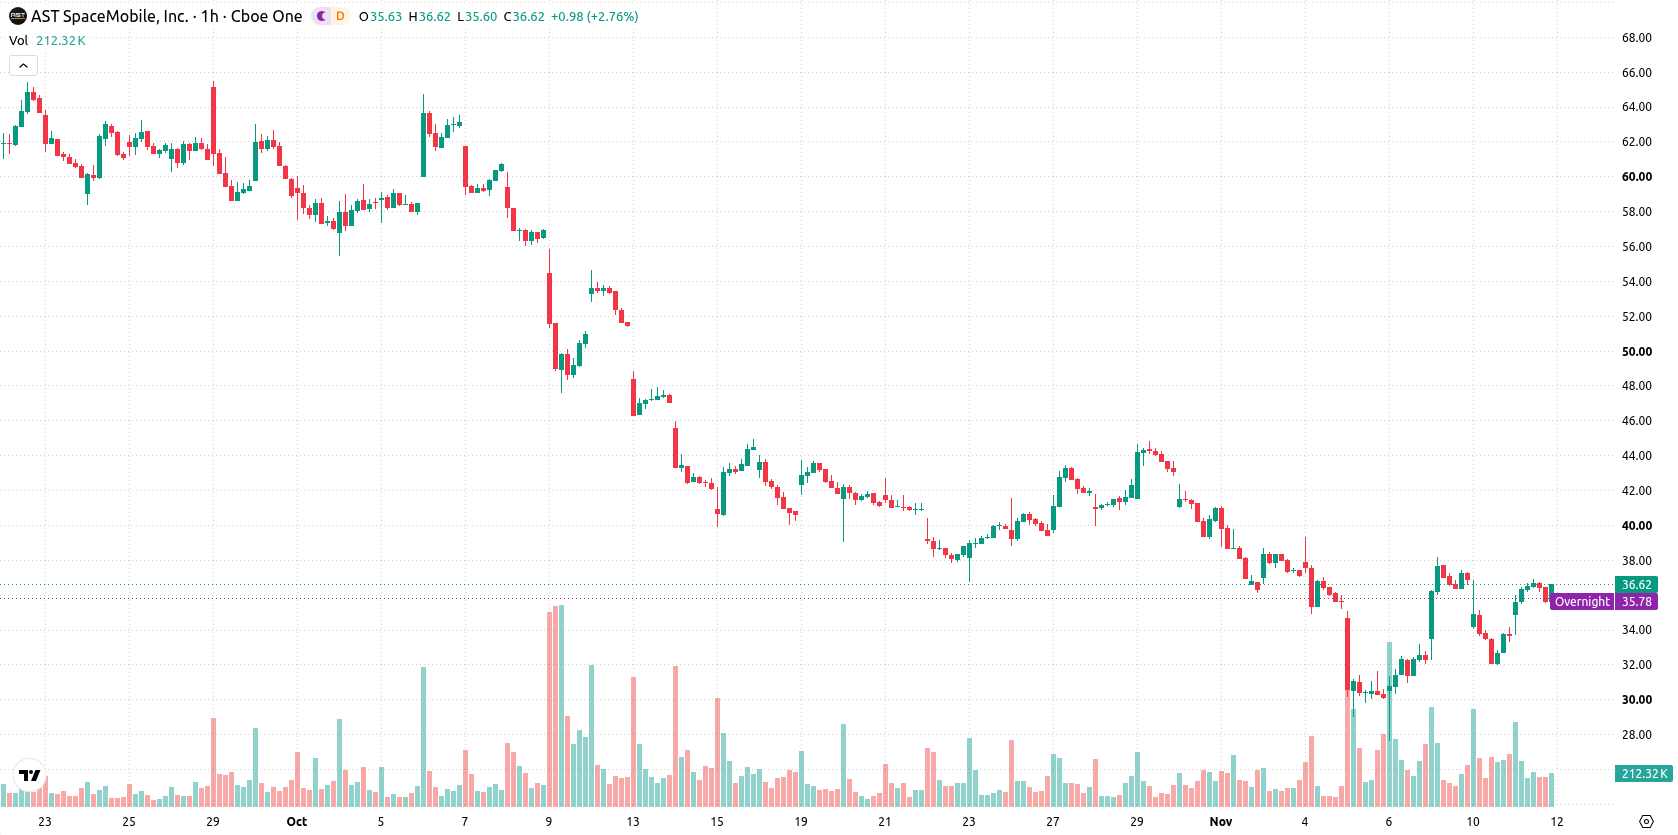
AST SpaceMobile (ASTS) stock is trading at $36.62, up 8.68% over the last 24 hours. The stock currently sits above its major short- and medium-term moving averages, reflecting strong momentum.
 34.27
38.11
Highlights
- AST SpaceMobile reported third-quarter 2026 revenue of $42.3 million, confirming strong year-over-year growth for the period.
- The company secured a $1.3 billion deal with Firefly Aerospace for engine supply and up to $1 billion in government backing for its Japanese venture with Rakuten.
- Shares of AST SpaceMobile gained 8.68% to $36.62 with bullish momentum, projected to trade in the $31.98 to $41.26 range over the next several days.
Revenue surge and strategic deals drive growth amid legal risks
AST SpaceMobile's third-quarter 2026 revenue rose sharply year over year to $42.3 million, confirming solid top line growth despite missing some expectations and serving as a focal point for investor sentiment, according to Defenseworld. The company also announced a $1.3 billion partnership with Firefly Aerospace to secure engine supply and engineering support for its rocket program, as reported by Cyprusshippingnews, while gaining up to $1 billion in government support for its Japanese joint venture with Rakuten to advance satellite-to-phone commercialization, per Finance Biggo. Disclosure of plans for its own reusable rocket and the filing of investor class action lawsuits round out a period marked by both operational milestones and governance uncertainties.
Mixed momentum signals as short-term support holds above key averages
On the technical front, ASTS/USD is trading above both the MA-20 at $35.49 and MA-50 at $34.73 on the H1 timeframe, while remaining below the longer-term MA-200 at $74.5. The Ichimoku Kijun level at $34.58 now serves as nearby support. Momentum signals are mixed: MACD indicates a buy, ADX is neutral, RSI and CCI sit in neutral zones, and Stoch RSI is in the overbought area. Bull/Bear Power is positive at 1.1, reflecting intraday buyer strength, while the Awesome Oscillator is neutral.
Consolidation likely as upside potential outweighs downside risks
Over the next 2-3 trading days, ASTS is expected to trade between $31.98 and $41.26, a typical volatility band relative to current levels. The probability of an upward move stands at 65%, while a downward move is less likely at 35%. The baseline scenario anticipates a period of consolidation within this range; a break above resistance could see further upside, while failure of support may trigger additional declines.
Earlier, analysts noted that AST SpaceMobile was experiencing sustained bearish momentum, with technical indicators highlighting downside risk. The current analysis points to a potential shift, as the stock has broken above key short- and medium-term moving averages, but traders should monitor the $31.98–$41.26 band for signs of either a sustained breakout or renewed weakness in the days ahead.






Latest AST SpaceMobile News



-
 Afghanistan
-
 Albania
-
 Algeria
-
 Angola
-
 Argentina
-
 Armenia
-
 Australia
-
 Austria
-
 Azerbaijan
-
 Bahamas
-
 Bahrain
-
 Bangladesh
-
 Belarus
-
 Belgium
-
 Bolivia
-
 Botswana
-
 Brazil
-
 Brunei
-
 Bulgaria
-
 Cambodia
-
 Cameroon
-
 Canada
-
 Chile
-
 China
-
 Colombia
-
 Congo
-
 Costa Rica
-
 Cote d'Ivoire
-
 Croatia
-
 Cuba
-
 Cyprus
-
 Czechia
-
 DR Congo
-
 Denmark
-
 Dominican Republic
-
 Ecuador
-
 Egypt
-
 El Salvador
-
 Estonia
-
 Eswatini
-
 Ethiopia
-
 Finland
-
 France
-
 Georgia
-
 Germany
-
 Ghana
-
 Greece
-
 Haiti
-
 Hong Kong
-
 Hungary
-
 India
-
 Indonesia
-
 Iran, Islamic republic
-
 Iraq
-
 Ireland
-
 Israel
-
 Italy
-
 Jamaica
-
 Japan
-
 Jordan
-
 Kazakhstan
-
 Kenya
-
 Korea
-
 Kuwait
-
 Kyrgyzstan
-
 Laos
-
 Latvia
-
 Lebanon
-
 Lesotho
-
 Libya
-
 Lithuania
-
 Luxembourg
-
 Madagascar
-
 Malaysia
-
 Malta
-
 Mauritius
-
 Mexico
-
 Moldova
-
 Mongolia
-
 Montenegro
-
 Morocco
-
 Mozambique
-
 Myanmar
-
 Namibia
-
 Nepal
-
 Netherlands
-
 New Zealand
-
 Nigeria
-
 North Macedonia
-
 Norway
-
 Oman
-
 Pakistan
-
 Palestine
-
 Panama
-
 Papua New Guinea
-
 Paraguay
-
 Peru
-
 Philippines
-
 Poland
-
 Portugal
-
 Puerto Rico
-
 Qatar
-
 Reunion
-
 Romania
-
 Rwanda
-
 Saudi Arabia
-
 Serbia
-
 Singapore
-
 Slovakia
-
 Slovenia
-
 Somalia
-
 South Africa
-
 Spain
-
 Sri Lanka
-
 Sweden
-
 Switzerland
-
 Syria
-
 Taiwan
-
 Tajikistan
-
 Tanzania
-
 Thailand
-
 Trinidad and Tobago
-
 Tunisia
-
 Turkey
-
 UAE
-
 Uganda
-
 Ukraine
-
 United Kingdom
-
United States
-
 Uruguay
-
 Uzbekistan
-
 Venezuela
-
 Vietnam
-
 Yemen
-
 Zambia
-
 Zimbabwe
- Forex
- Crypto












