

Will Royal Bank of Canada stock extend gains amid mixed momentum signals?

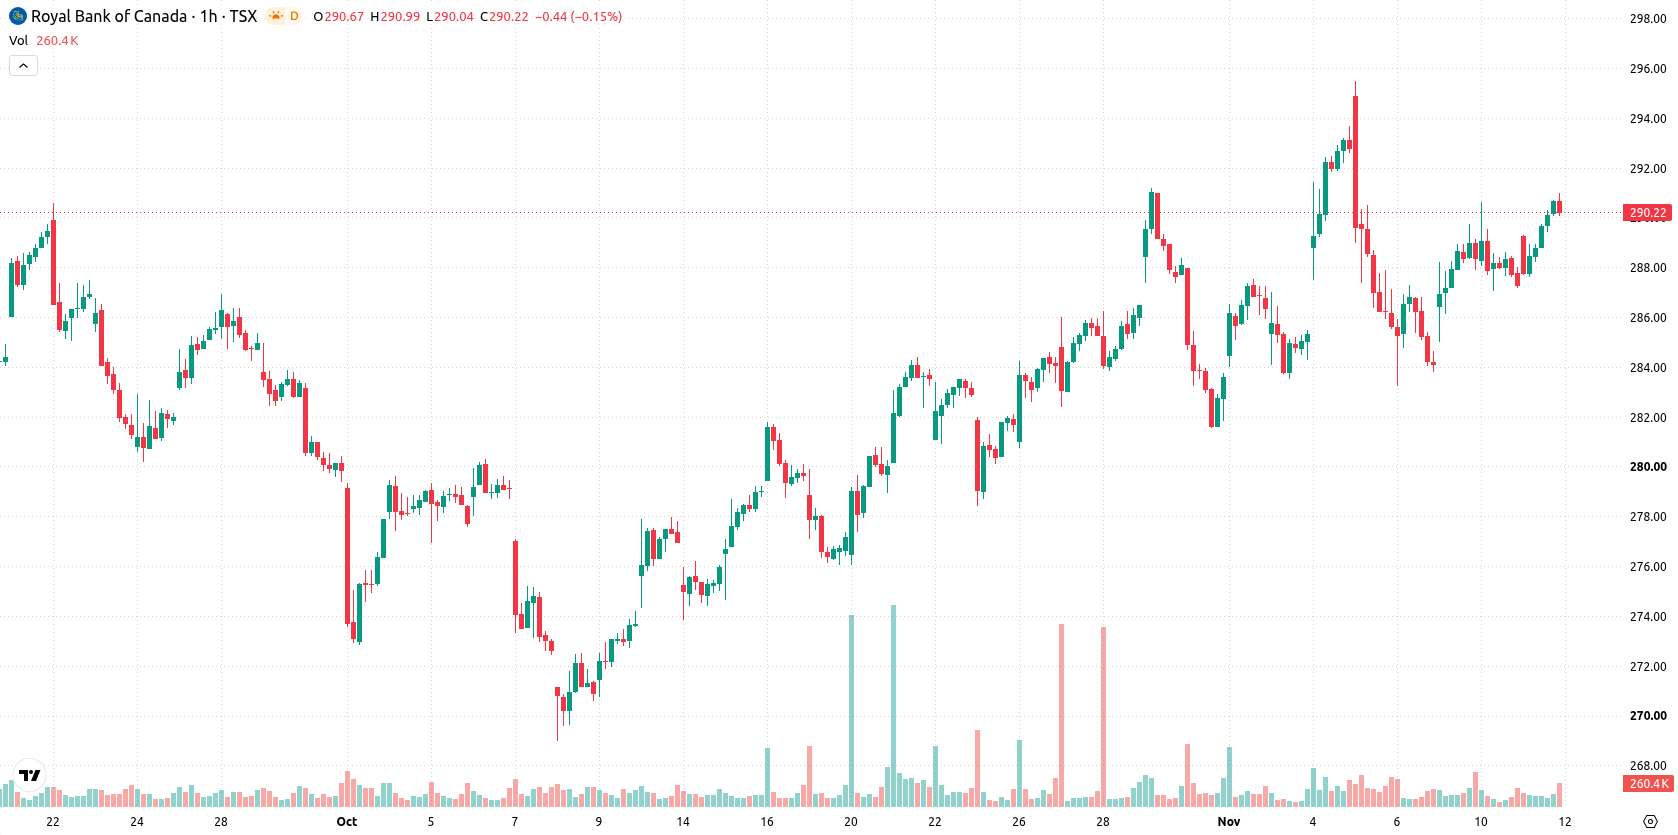
Royal Bank of Canada (RY) stock is trading at C$290, marking a modest gain for the day and hovering near the intraday high. The price remains above its key short- and medium-term moving averages, reflecting ongoing upward momentum.
 290.32
290.95
Highlights
- RY/CAD trades firmly in a short-, medium-, and long-term uptrend, maintaining levels above major moving averages.
- Momentum indicators confirm a prevailing bullish setup, though overbought conditions suggest risk of a near-term pullback.
- The stock is forecast to move between C$284.63 to C$295.37 over the next 2 to 3 sessions, with a 77% probability of upward movement.
Technical indicators mixed as overbought signals clash with support
On the technical front, RY is trading above the MA-20 at C$288.57 and the MA-50 at C$287.86 on the hourly chart, with the daily MA-200 well below at C$264.95. The Ichimoku Kijun at C$287.41 is providing immediate support, while the price action is contained within the C$284.63–C$295.37 band for the coming sessions. Momentum indicators present a mixed picture: MACD is on a Buy signal, ADX is Neutral, while both RSI and Stochastic RSI are also neutral. However, CCI is in the overbought zone, suggesting a possible risk of a near-term pullback. Bull/Bear Power at 1.96 signals buyers are currently in control intraday, and the Awesome Oscillator remains aligned with the bullish bias.
Upside favored as probability supports further gains
Over the next two to three trading days, RY is expected to fluctuate between C$284.63 and C$295.37, which represents a typical volatility band relative to current levels. The probability of an upward move is currently estimated at 77%, making further gains more likely in the short term. A confirmed breakout above the upper resistance would open the way for additional upside, while a move below support could trigger a bearish scenario.
Earlier, analysts noted that Royal Bank of Canada's stock was expected to consolidate as technical indicators presented a mixed but supportive outlook. The latest data confirm continued upward momentum, with traders advised to monitor the C$295.37 resistance for signs of a potential breakout and further gains.












-
 Afghanistan
-
 Albania
-
 Algeria
-
 Angola
-
 Argentina
-
 Armenia
-
 Australia
-
 Austria
-
 Azerbaijan
-
 Bahamas
-
 Bahrain
-
 Bangladesh
-
 Belarus
-
 Belgium
-
 Bolivia
-
 Botswana
-
 Brazil
-
 Brunei
-
 Bulgaria
-
 Cambodia
-
 Cameroon
-
 Canada
-
 Chile
-
 China
-
 Colombia
-
 Congo
-
 Costa Rica
-
 Cote d'Ivoire
-
 Croatia
-
 Cuba
-
 Cyprus
-
 Czechia
-
 DR Congo
-
 Denmark
-
 Dominican Republic
-
 Ecuador
-
 Egypt
-
 El Salvador
-
 Estonia
-
 Eswatini
-
 Ethiopia
-
 Finland
-
 France
-
 Georgia
-
 Germany
-
 Ghana
-
 Greece
-
 Haiti
-
 Hong Kong
-
 Hungary
-
 India
-
 Indonesia
-
 Iran, Islamic republic
-
 Iraq
-
 Ireland
-
 Israel
-
 Italy
-
 Jamaica
-
 Japan
-
 Jordan
-
 Kazakhstan
-
 Kenya
-
 Korea
-
 Kuwait
-
 Kyrgyzstan
-
 Laos
-
 Latvia
-
 Lebanon
-
 Lesotho
-
 Libya
-
 Lithuania
-
 Luxembourg
-
 Madagascar
-
 Malaysia
-
 Malta
-
 Mauritius
-
 Mexico
-
 Moldova
-
 Mongolia
-
 Montenegro
-
 Morocco
-
 Mozambique
-
 Myanmar
-
 Namibia
-
 Nepal
-
 Netherlands
-
 New Zealand
-
 Nigeria
-
 North Macedonia
-
 Norway
-
 Oman
-
 Pakistan
-
 Palestine
-
 Panama
-
 Papua New Guinea
-
 Paraguay
-
 Peru
-
 Philippines
-
 Poland
-
 Portugal
-
 Puerto Rico
-
 Qatar
-
 Reunion
-
 Romania
-
 Rwanda
-
 Saudi Arabia
-
 Serbia
-
 Singapore
-
 Slovakia
-
 Slovenia
-
 Somalia
-
 South Africa
-
 Spain
-
 Sri Lanka
-
 Sweden
-
 Switzerland
-
 Syria
-
 Taiwan
-
 Tajikistan
-
 Tanzania
-
 Thailand
-
 Trinidad and Tobago
-
 Tunisia
-
 Turkey
-
 UAE
-
 Uganda
-
 Ukraine
-
 United Kingdom
-
United States
-
 Uruguay
-
 Uzbekistan
-
 Venezuela
-
 Vietnam
-
 Yemen
-
 Zambia
-
 Zimbabwe
- Forex
- Crypto












