

Chevron stock holds contested range as technical signals remain neutral ahead of key resistance: weekly analysis

Shares of Chevron Corporation (CVX) are trading near $213, with the daily chart pointing to a contested technical zone. The setup shows mixed signals, as selling momentum has brought the stock into oversold territory, while rebound potential is apparent heading into the week. Uncertainty over direction keeps both upside and downside in play as the coming days unfold.
 219.91
Highlights
- Shares of Chevron are trading at $213.2, remaining below key short-term moving averages but above the long-term trend level.
- Technical indicators show mixed momentum, with oversold conditions and recent volatility of 7.98% suggesting possible rebound potential.
- Chevron stock is projected to fluctuate between $205.84 to $225.01 in the coming week, with $215.22 as key resistance and $206.01 as major support.
Robust quarterly earnings and portfolio moves support sentiment this week
Chevron posted its third quarter 2026 results with $65.6 billion in revenue and $9.9 billion in net income, demonstrating robust cash generation, according to Yahoo Finance. The company also reaffirmed its quarterly dividend and reported a reduction in total debt to $33.5 billion, based on Trefis coverage. In addition, Chevron advanced its international portfolio by farming out a 25% interest in its Namibia offshore exploration license to QatarEnergy, and it plans to invest over $7 billion in Venezuela over five years, potentially doubling oil production there, as reported by The Motley Fool.
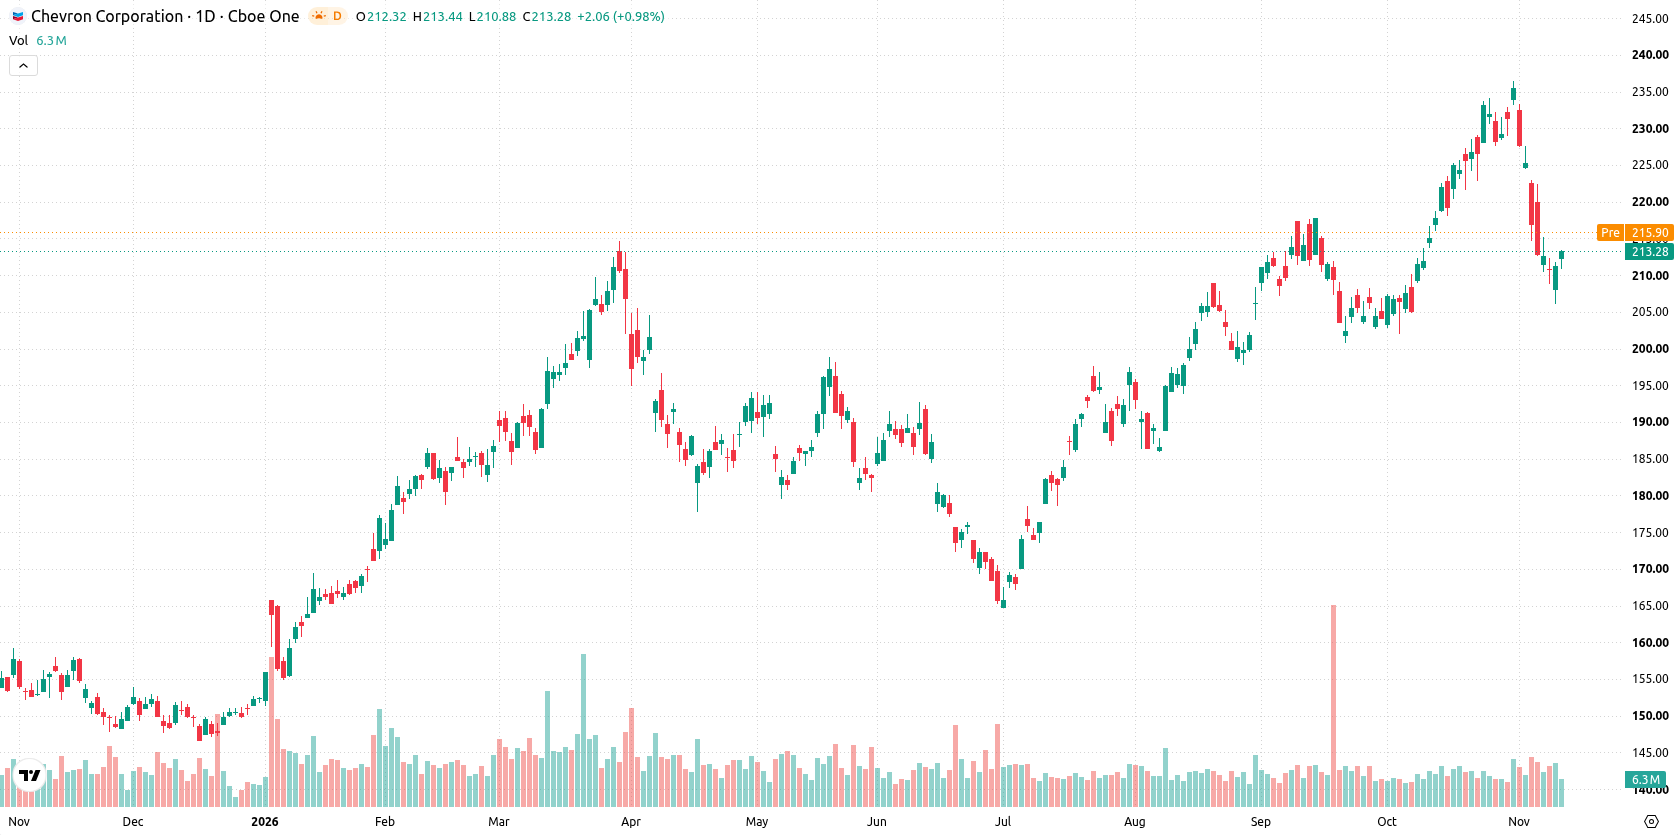
Mixed technical indicators highlight rebound potential after volatile week
On the daily chart, the setup shows Chevron stock caught between emerging bullish momentum and underlying caution. Momentum is mixed, with CCI and Stochastic RSI both registering in the oversold zone, suggesting possible selling exhaustion and rebound potential, while the MACD direction remains neutral. Volatility over the past week has been notable at 7.98%. Support is marked at $206.01, with resistance lined up at $215.22 and the Ichimoku Kijun acting as an additional barrier at $220.66.
Balanced risk seen as Chevron trades within confirmed weekly range
Over the coming trading week, the expected range is $205.84 to $225.01, with an even 50% probability of either an increase or decrease in price. The base case sees Chevron stock fluctuating within this range as a developing move continues to seek confirmation. A close above $215.22 would open potential for a push toward $225.01, while a drop below $206.01 would increase downside risk toward the lower end of the range.
Earlier, analysts noted that Chevron’s technical outlook was mixed, with lingering support offset by prevailing short-term resistance and a focus on potential directional shifts. The current setup adds fundamental strength via solid quarterly results and new international initiatives, suggesting traders should watch the $215.22 resistance and $206.01 support levels for signs of a decisive move outside the recent range.






Latest Chevron News





-
 Afghanistan
-
 Albania
-
 Algeria
-
 Angola
-
 Argentina
-
 Armenia
-
 Australia
-
 Austria
-
 Azerbaijan
-
 Bahamas
-
 Bahrain
-
 Bangladesh
-
 Belarus
-
 Belgium
-
 Bolivia
-
 Botswana
-
 Brazil
-
 Brunei
-
 Bulgaria
-
 Cambodia
-
 Cameroon
-
 Canada
-
 Chile
-
 China
-
 Colombia
-
 Congo
-
 Costa Rica
-
 Cote d'Ivoire
-
 Croatia
-
 Cuba
-
 Cyprus
-
 Czechia
-
 DR Congo
-
 Denmark
-
 Dominican Republic
-
 Ecuador
-
 Egypt
-
 El Salvador
-
 Estonia
-
 Eswatini
-
 Ethiopia
-
 Finland
-
 France
-
 Georgia
-
 Germany
-
 Ghana
-
 Greece
-
 Haiti
-
 Hong Kong
-
 Hungary
-
 India
-
 Indonesia
-
 Iran, Islamic republic
-
 Iraq
-
 Ireland
-
 Israel
-
 Italy
-
 Jamaica
-
 Japan
-
 Jordan
-
 Kazakhstan
-
 Kenya
-
 Korea
-
 Kuwait
-
 Kyrgyzstan
-
 Laos
-
 Latvia
-
 Lebanon
-
 Lesotho
-
 Libya
-
 Lithuania
-
 Luxembourg
-
 Madagascar
-
 Malaysia
-
 Malta
-
 Mauritius
-
 Mexico
-
 Moldova
-
 Mongolia
-
 Montenegro
-
 Morocco
-
 Mozambique
-
 Myanmar
-
 Namibia
-
 Nepal
-
 Netherlands
-
 New Zealand
-
 Nigeria
-
 North Macedonia
-
 Norway
-
 Oman
-
 Pakistan
-
 Palestine
-
 Panama
-
 Papua New Guinea
-
 Paraguay
-
 Peru
-
 Philippines
-
 Poland
-
 Portugal
-
 Puerto Rico
-
 Qatar
-
 Reunion
-
 Romania
-
 Rwanda
-
 Saudi Arabia
-
 Serbia
-
 Singapore
-
 Slovakia
-
 Slovenia
-
 Somalia
-
 South Africa
-
 Spain
-
 Sri Lanka
-
 Sweden
-
 Switzerland
-
 Syria
-
 Taiwan
-
 Tajikistan
-
 Tanzania
-
 Thailand
-
 Trinidad and Tobago
-
 Tunisia
-
 Turkey
-
 UAE
-
 Uganda
-
 Ukraine
-
 United Kingdom
-
United States
-
 Uruguay
-
 Uzbekistan
-
 Venezuela
-
 Vietnam
-
 Yemen
-
 Zambia
-
 Zimbabwe
- Forex
- Crypto












