

Lucid Group shares fall nearly 6% as cash flow improvement fails to offset technical pressures

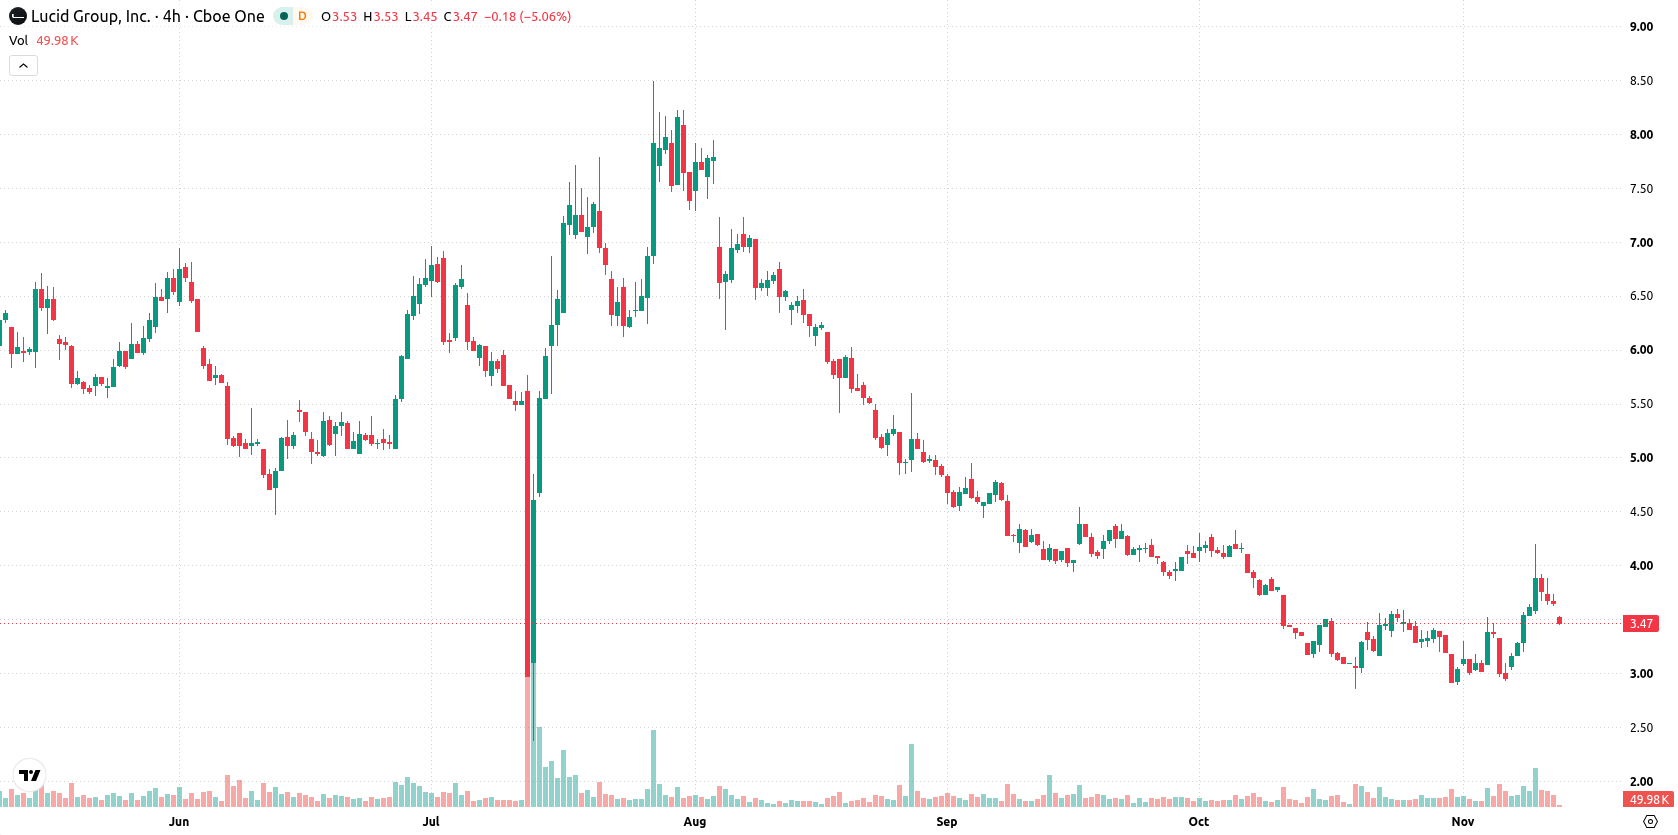
Lucid Group, Inc. (LCID) declined 5.75% after reporting a reduction in free cash outflow and an increase in liquidity in its latest quarterly update. The size of the drop is supported by ongoing medium- and long-term technical pressures, with the stock trading below both its 50-day and 200-day moving averages.
 3.15
4.20
Highlights
- Lucid Group cut free cash outflow by 30% quarter over quarter through reduced production, inventory sales, and a cost-reduction program.
- Quarterly revenue rose 4% year over year to $350 million, with liquidity boosted by a $1.75 billion injection from the Saudi Arabia Public Investment Fund.
- Shares of Lucid Group trade with short-term support but face medium- and long-term downward pressure, with a 60% probability of further downside and a projected range of $2.87 to $4.01 over the next five sessions.
Funding-led liquidity rise offsets losses as selling pressure persists
Lucid Group reported third-quarter 2026 results, highlighting a 30% quarter-over-quarter reduction in free cash outflow by lowering production, selling inventory vehicles, and executing a cost-reduction plan. Quarterly revenue rose 4% year-over-year to $350 million, and the company continued to post significant losses. Liquidity increased by $1.75 billion during the period, largely driven by funding from the Saudi Arabia Public Investment Fund, though price action has remained under broader selling pressure.
Mixed momentum and resistance levels signal risk of near-term pullback
Lucid Group is trading above its 20-day moving average (MA-20) at $3.31 but remains below both the 50-day (MA-50) at $3.79 and the 200-day (MA-200) at $6.57. This setup points to short-term support with medium- and long-term trends still under pressure, reflecting a bearish alignment between the MA-50 and MA-200. Resistance is observed at $3.55 (Ichimoku Kijun) and support at $3.31 (MA-20). Momentum readings are mixed. The MACD signals strong selling, the ADX shows a neutral trend, and the RSI also remains neutral. However, both Stochastic RSI and CCI are in overbought zones, suggesting risk of a short-term pullback in those indicators. Bull/Bear Power is positive intraday at 0.47, while the Awesome Oscillator gives a neutral reading. Price action remains under pressure, with downside follow-through after an opening upside gap and intraday volatility registering 6.91%. Intraday technicals and oscillators display conflicting signals.
Earlier, analysts noted that despite liquidity improvements and operational adjustments, Lucid Group continued to face persistent technical and earnings pressures. The current analysis underscores an increased risk of further downside over the next five days, with $3.31 now serving as a crucial support level to monitor for signs of either stabilization or deeper declines.






Latest Lucid Motors News




-
 Afghanistan
-
 Albania
-
 Algeria
-
 Angola
-
 Argentina
-
 Armenia
-
 Australia
-
 Austria
-
 Azerbaijan
-
 Bahamas
-
 Bahrain
-
 Bangladesh
-
 Belarus
-
 Belgium
-
 Bolivia
-
 Botswana
-
 Brazil
-
 Brunei
-
 Bulgaria
-
 Cambodia
-
 Cameroon
-
 Canada
-
 Chile
-
 China
-
 Colombia
-
 Congo
-
 Costa Rica
-
 Cote d'Ivoire
-
 Croatia
-
 Cuba
-
 Cyprus
-
 Czechia
-
 DR Congo
-
 Denmark
-
 Dominican Republic
-
 Ecuador
-
 Egypt
-
 El Salvador
-
 Estonia
-
 Eswatini
-
 Ethiopia
-
 Finland
-
 France
-
 Georgia
-
 Germany
-
 Ghana
-
 Greece
-
 Haiti
-
 Hong Kong
-
 Hungary
-
 India
-
 Indonesia
-
 Iran, Islamic republic
-
 Iraq
-
 Ireland
-
 Israel
-
 Italy
-
 Jamaica
-
 Japan
-
 Jordan
-
 Kazakhstan
-
 Kenya
-
 Korea
-
 Kuwait
-
 Kyrgyzstan
-
 Laos
-
 Latvia
-
 Lebanon
-
 Lesotho
-
 Libya
-
 Lithuania
-
 Luxembourg
-
 Madagascar
-
 Malaysia
-
 Malta
-
 Mauritius
-
 Mexico
-
 Moldova
-
 Mongolia
-
 Montenegro
-
 Morocco
-
 Mozambique
-
 Myanmar
-
 Namibia
-
 Nepal
-
 Netherlands
-
 New Zealand
-
 Nigeria
-
 North Macedonia
-
 Norway
-
 Oman
-
 Pakistan
-
 Palestine
-
 Panama
-
 Papua New Guinea
-
 Paraguay
-
 Peru
-
 Philippines
-
 Poland
-
 Portugal
-
 Puerto Rico
-
 Qatar
-
 Reunion
-
 Romania
-
 Rwanda
-
 Saudi Arabia
-
 Serbia
-
 Singapore
-
 Slovakia
-
 Slovenia
-
 Somalia
-
 South Africa
-
 Spain
-
 Sri Lanka
-
 Sweden
-
 Switzerland
-
 Syria
-
 Taiwan
-
 Tajikistan
-
 Tanzania
-
 Thailand
-
 Trinidad and Tobago
-
 Tunisia
-
 Turkey
-
 UAE
-
 Uganda
-
 Ukraine
-
 United Kingdom
-
United States
-
 Uruguay
-
 Uzbekistan
-
 Venezuela
-
 Vietnam
-
 Yemen
-
 Zambia
-
 Zimbabwe
- Forex
- Crypto












