

UAVS slides over 3% as technical indicators remain bearish amid lack of news

AgEagle Aerial Systems (UAVS) fell 3.16% as heavy technical momentum and persistent selling pressure drove the session lower, with no fresh company news driving the move. The downside is supported by the stock remaining well below all major moving averages, reinforcing the bearish setup.
 0.3699
0.4180
Highlights
- AgEagle stock trades well below key moving averages, confirming sustained bearish momentum across short-, medium-, and long-term trends.
- Momentum indicators remain negative overall, with strong downside pressure and mixed short-term sentiment due to divergent RSI and Stochastic RSI zones.
- Shares last traded at $0.37, with anticipated range of $0.3 to $0.44 over five sessions and over 80% probability of further downside.
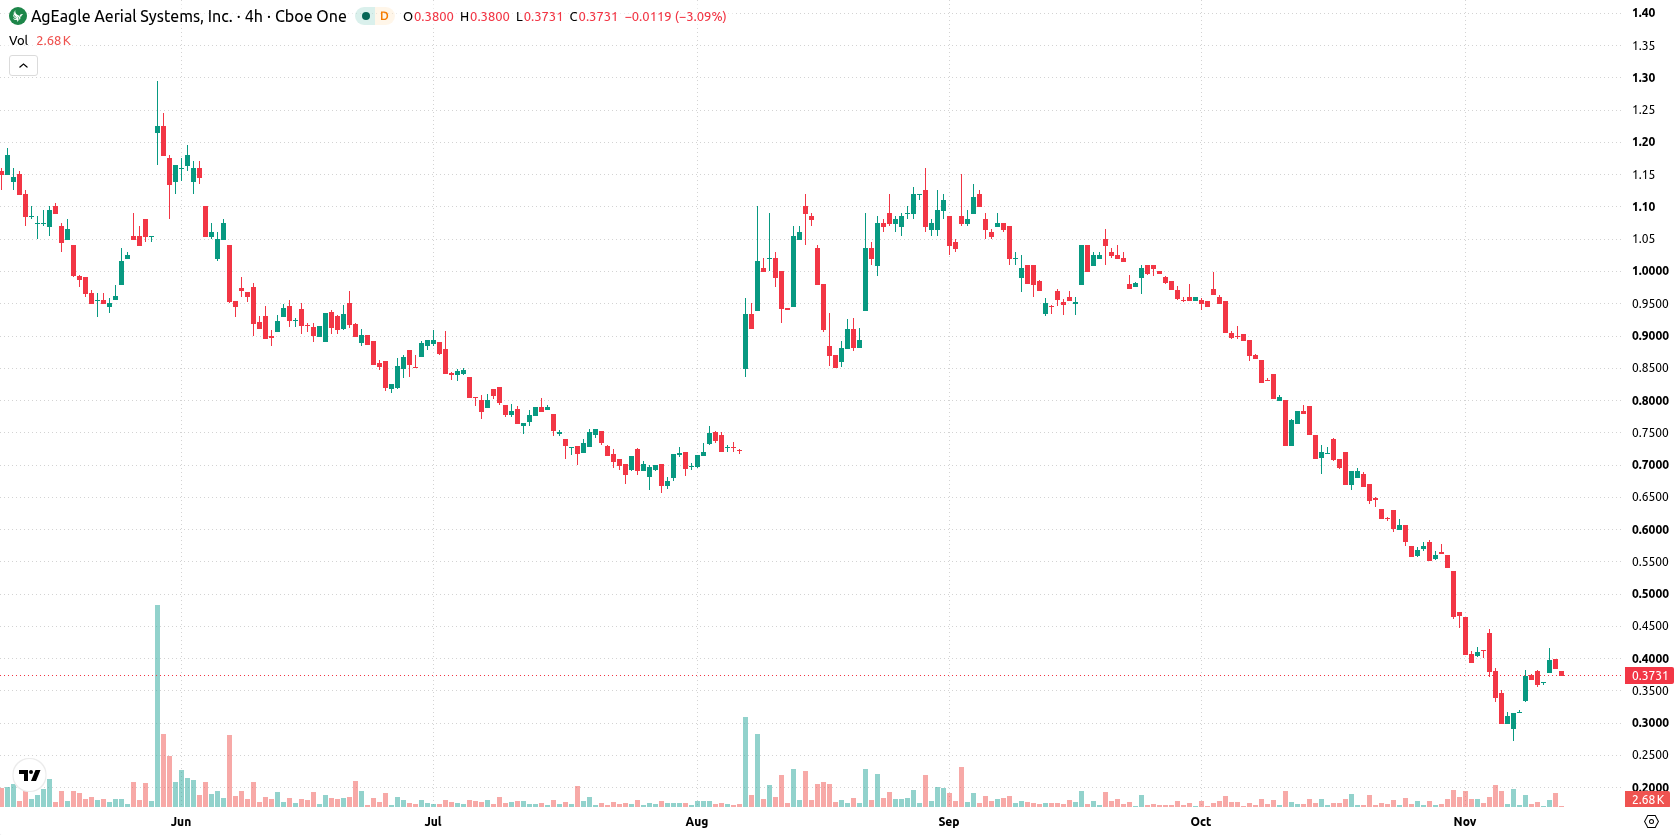
Bearish structure deepens as divergence emerges across momentum indicators
AgEagle trades well below its 20-day, 50-day, and 200-day moving averages ($0.51, $0.77, $0.92 respectively), pointing to continued selling pressure across short-, medium-, and long-term trends. The nearest resistance stands at $0.41 and support at $0.37, with the alignment of the MA-50 and MA-200 confirming the longer-term bearish structure. Momentum indicators stay negative: MACD and ADX both reflect strong downside momentum. The RSI is in the oversold zone, hinting at selling exhaustion, while the Stochastic RSI is in the overbought zone, indicating possible correction risk; CCI is neutral. The Bull/Bear Power (BBP) points to sellers dominating intraday action. The Awesome Oscillator is neutral, providing no signal for the current trend. The divergence between the RSI and Stochastic RSI zones underlines mixed short-term sentiment.
Earlier, analysts noted that AgEagle's technical landscape had shown modest improvement, with a cautious focus on key support and resistance as pivotal for the next directional move. The latest data confirms a firm shift back to a bearish structure, and traders should now watch for any break of the $0.37 support as a potential trigger for further downside risk.









-
 Afghanistan
-
 Albania
-
 Algeria
-
 Angola
-
 Argentina
-
 Armenia
-
 Australia
-
 Austria
-
 Azerbaijan
-
 Bahamas
-
 Bahrain
-
 Bangladesh
-
 Belarus
-
 Belgium
-
 Bolivia
-
 Botswana
-
 Brazil
-
 Brunei
-
 Bulgaria
-
 Cambodia
-
 Cameroon
-
 Canada
-
 Chile
-
 China
-
 Colombia
-
 Congo
-
 Costa Rica
-
 Cote d'Ivoire
-
 Croatia
-
 Cuba
-
 Cyprus
-
 Czechia
-
 DR Congo
-
 Denmark
-
 Dominican Republic
-
 Ecuador
-
 Egypt
-
 El Salvador
-
 Estonia
-
 Eswatini
-
 Ethiopia
-
 Finland
-
 France
-
 Georgia
-
 Germany
-
 Ghana
-
 Greece
-
 Haiti
-
 Hong Kong
-
 Hungary
-
 India
-
 Indonesia
-
 Iran, Islamic republic
-
 Iraq
-
 Ireland
-
 Israel
-
 Italy
-
 Jamaica
-
 Japan
-
 Jordan
-
 Kazakhstan
-
 Kenya
-
 Korea
-
 Kuwait
-
 Kyrgyzstan
-
 Laos
-
 Latvia
-
 Lebanon
-
 Lesotho
-
 Libya
-
 Lithuania
-
 Luxembourg
-
 Madagascar
-
 Malaysia
-
 Malta
-
 Mauritius
-
 Mexico
-
 Moldova
-
 Mongolia
-
 Montenegro
-
 Morocco
-
 Mozambique
-
 Myanmar
-
 Namibia
-
 Nepal
-
 Netherlands
-
 New Zealand
-
 Nigeria
-
 North Macedonia
-
 Norway
-
 Oman
-
 Pakistan
-
 Palestine
-
 Panama
-
 Papua New Guinea
-
 Paraguay
-
 Peru
-
 Philippines
-
 Poland
-
 Portugal
-
 Puerto Rico
-
 Qatar
-
 Reunion
-
 Romania
-
 Rwanda
-
 Saudi Arabia
-
 Serbia
-
 Singapore
-
 Slovakia
-
 Slovenia
-
 Somalia
-
 South Africa
-
 Spain
-
 Sri Lanka
-
 Sweden
-
 Switzerland
-
 Syria
-
 Taiwan
-
 Tajikistan
-
 Tanzania
-
 Thailand
-
 Trinidad and Tobago
-
 Tunisia
-
 Turkey
-
 UAE
-
 Uganda
-
 Ukraine
-
 United Kingdom
-
United States
-
 Uruguay
-
 Uzbekistan
-
 Venezuela
-
 Vietnam
-
 Yemen
-
 Zambia
-
 Zimbabwe
- Forex
- Crypto












