

What's behind Iris Energy's latest 5.4% stock pullback?

Iris Energy Limited (IREN) slid 5.42% as persistent seller pressure overshadowed reported revenue gains. The decline is reinforced by the stock trading below its 20-day, 50-day, and 200-day moving averages, anchoring a broadly bearish technical structure.
 19.13
22.26
Highlights
- Iris Energy reported $228 million in quarterly revenue, driven by expansion in its AI Cloud segment.
- The company remains unprofitable with a significant debt load and has committed to an annual recurring revenue target above $4 billion, which it states is fully contracted and funded.
- Shares of Iris Energy trade below key moving averages with strong bearish momentum indicators and are expected to range from $18.05 to $21.37 over the next five trading days.
Revenue growth focus softens but debt and volatility fuel caution
Iris Energy reported quarterly revenue of $228 million, led by growth in its AI Cloud division and characterized its annual recurring revenue target of over $4 billion as fully contracted and funded. The company remains unprofitable and has experienced notable attention to its large debt load and delays in profitability. Recent volatility in IREN shares has been accompanied by reaction to industry events, including developments with key partner Nvidia and concerns about sector refinancing risks, though price action has remained under broader selling pressure.
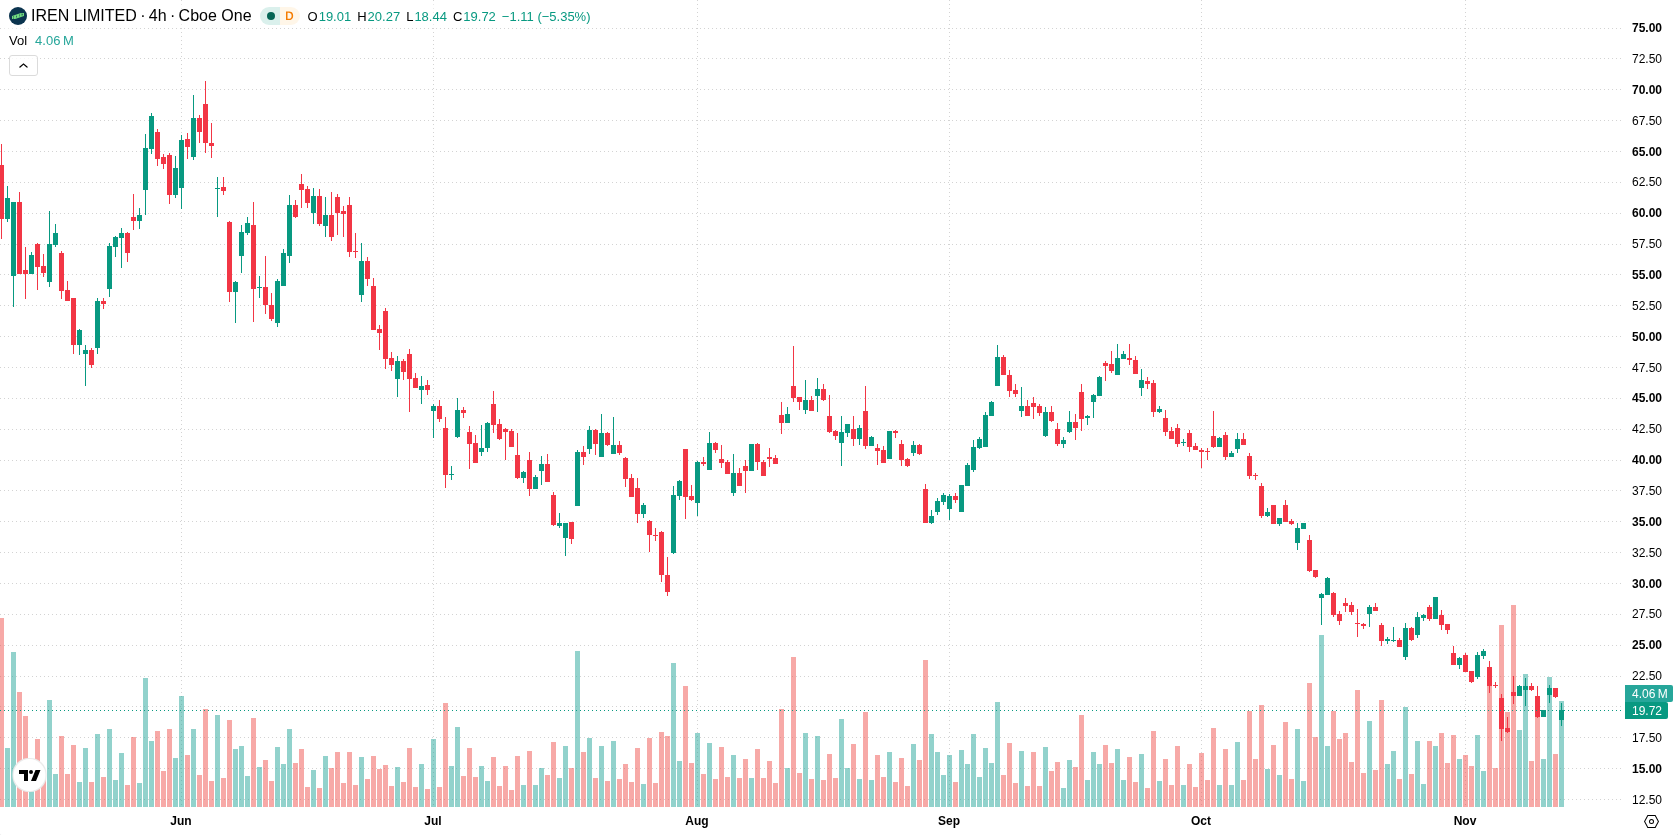
Bearish momentum prevails as multitimeframe breakdowns meet correction risk
Iris Energy is trading below its 20-day, 50-day, and 200-day moving averages ($24.6, $34.92, $43.02), indicating persistent seller pressure across short-, medium-, and long-term trends. The immediate trading corridor is defined by a near-term ceiling at $21.37 and a near-term floor at $19.03, with the Ichimoku Kijun at $28.75 far overhead confirming ongoing bearish structure. Momentum signals remain decisively bearish. The Moving Average Convergence Divergence (MACD) and Average Directional Index (ADX) point to strong downside momentum. The Relative Strength Index (RSI) and Commodity Channel Index (CCI) are both neutral, while the Stochastic RSI is overbought—this suggests potential near-term correction risk, not sustained selling. Bull/Bear Power (BBP) is negative, showing sellers dominate intraday activity. The stock last traded at $19.71, down $1.13 or 5.42% for the session, after opening with a pronounced downside gap of $1.82 (gap percentage of 8.73%). The price has remained near the session low with intraday volatility at 0.00%, reflecting persistent selling pressure after the open. This aligns with the prevailing bearish momentum from MACD and ADX, though the overbought Stochastic RSI flags the potential for short-term swings.
Earlier, analysts noted that Iris Energy faced sustained selling pressure and lingering concerns over execution risk and funding vulnerabilities despite strong growth in its AI cloud segment. The current technical setup reinforces this bearish outlook, with traders advised to monitor the $18.05 level as a trigger for additional downside risk in the coming sessions.






Latest IREN Limited News



-
 Afghanistan
-
 Albania
-
 Algeria
-
 Angola
-
 Argentina
-
 Armenia
-
 Australia
-
 Austria
-
 Azerbaijan
-
 Bahamas
-
 Bahrain
-
 Bangladesh
-
 Belarus
-
 Belgium
-
 Bolivia
-
 Botswana
-
 Brazil
-
 Brunei
-
 Bulgaria
-
 Cambodia
-
 Cameroon
-
 Canada
-
 Chile
-
 China
-
 Colombia
-
 Congo
-
 Costa Rica
-
 Cote d'Ivoire
-
 Croatia
-
 Cuba
-
 Cyprus
-
 Czechia
-
 DR Congo
-
 Denmark
-
 Dominican Republic
-
 Ecuador
-
 Egypt
-
 El Salvador
-
 Estonia
-
 Eswatini
-
 Ethiopia
-
 Finland
-
 France
-
 Georgia
-
 Germany
-
 Ghana
-
 Greece
-
 Haiti
-
 Hong Kong
-
 Hungary
-
 India
-
 Indonesia
-
 Iran, Islamic republic
-
 Iraq
-
 Ireland
-
 Israel
-
 Italy
-
 Jamaica
-
 Japan
-
 Jordan
-
 Kazakhstan
-
 Kenya
-
 Korea
-
 Kuwait
-
 Kyrgyzstan
-
 Laos
-
 Latvia
-
 Lebanon
-
 Lesotho
-
 Libya
-
 Lithuania
-
 Luxembourg
-
 Madagascar
-
 Malaysia
-
 Malta
-
 Mauritius
-
 Mexico
-
 Moldova
-
 Mongolia
-
 Montenegro
-
 Morocco
-
 Mozambique
-
 Myanmar
-
 Namibia
-
 Nepal
-
 Netherlands
-
 New Zealand
-
 Nigeria
-
 North Macedonia
-
 Norway
-
 Oman
-
 Pakistan
-
 Palestine
-
 Panama
-
 Papua New Guinea
-
 Paraguay
-
 Peru
-
 Philippines
-
 Poland
-
 Portugal
-
 Puerto Rico
-
 Qatar
-
 Reunion
-
 Romania
-
 Rwanda
-
 Saudi Arabia
-
 Serbia
-
 Singapore
-
 Slovakia
-
 Slovenia
-
 Somalia
-
 South Africa
-
 Spain
-
 Sri Lanka
-
 Sweden
-
 Switzerland
-
 Syria
-
 Taiwan
-
 Tajikistan
-
 Tanzania
-
 Thailand
-
 Trinidad and Tobago
-
 Tunisia
-
 Turkey
-
 UAE
-
 Uganda
-
 Ukraine
-
 United Kingdom
-
United States
-
 Uruguay
-
 Uzbekistan
-
 Venezuela
-
 Vietnam
-
 Yemen
-
 Zambia
-
 Zimbabwe
- Forex
- Crypto












