

GE Aerospace stock slips as overbought Stoch RSI warns of a short-term correction

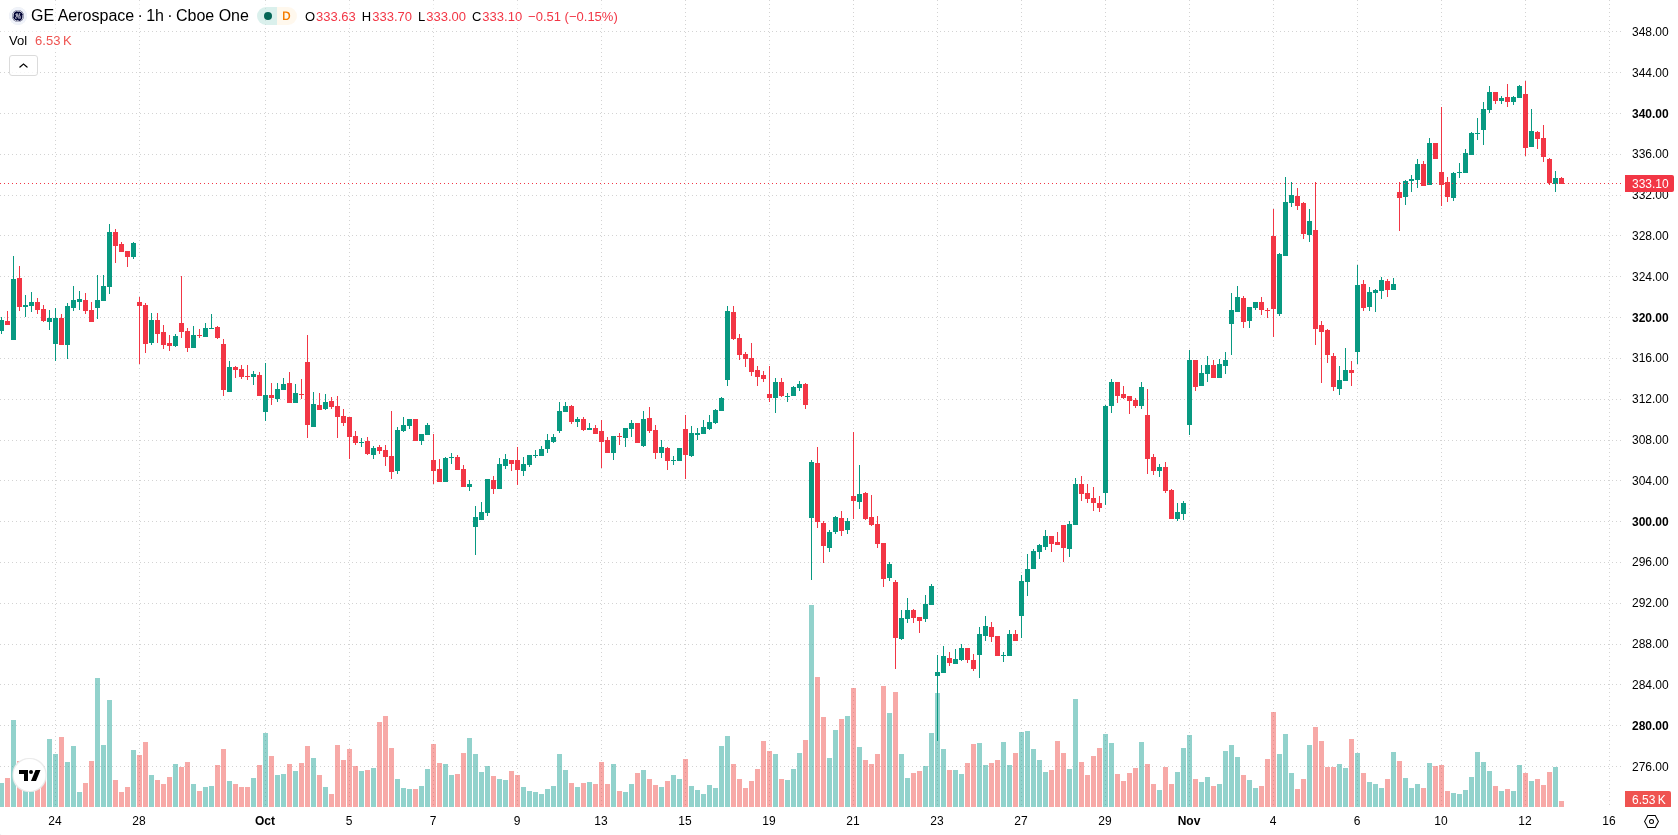
GE Aerospace (GE) stock is trading at $332.34, reflecting a daily decline of 3%. The price stands below its short-term moving average but is still positioned above its medium- and long-term averages.
 333.05
342.80
Highlights
- Ritholtz Wealth Management cut its GE Aerospace stake by 6.7% in Q3, potentially increasing selling pressure on the shares.
- AlphaCore Capital LLC and Bahl & Gaynor LLC increased their GE stock holdings by 15% and 37.4% respectively during the same period.
- GE stock fell 3% to $332.34 with short-term seller pressure, and is expected to consolidate between $320.3 and $344.38 over the next 2 to 3 days.
Selective institutional shifts offset selling but keep shares pressured
Ritholtz Wealth Management reduced its stake in GE Aerospace by 6.7% during the third quarter, as reported by Themarketsdaily, representing a notable withdrawal by a named institutional investor that may exert additional selling pressure on the shares. Offsetting this, AlphaCore Capital LLC expanded its position in GE by 15.0% and Bahl & Gaynor LLC boosted its holdings by 37.4% over the same period, according to Americanbankingnews and MarketBeat, respectively. These divergent institutional moves suggest a shift in the balance of ownership, where selective buying partially mitigates the impact of recent selling activity, though price action has remained under broader selling pressure.
Bullish momentum faces overbought risks as technical supports hold
Technically, GE trades below its MA-20 but above the MA-50 on the hourly chart and above the MA-200 on the daily chart. The Ichimoku Kijun level at $331.66 serves as immediate support for the current session. Both MACD and ADX signal bullish momentum, while RSI, Stochastic RSI, and CCI are positioned in overbought territory, highlighting the potential for a short-term downside correction. Bull/Bear Power remains positive, reflecting intraday buyer presence, and the Awesome Oscillator is currently neutral, offering no confirmation of trend direction.
Rangebound trading likely as modest upside edge persists
Over the next 2–3 trading days, GE is expected to fluctuate within a volatility band between $320.3 and $344.38. The probability of an upside move stands at 55%, suggesting a marginal edge for recovery but not a decisive trend. The base case scenario aligns with continued consolidation within this range, while a break above resistance could open the path to higher prices toward the upper end of the band; conversely, a breach below immediate support would pave the way for a short-term pullback.
Earlier, analysts noted that shifting procurement strategies among major power equipment buyers created uncertainty for related industrial stocks, including GE Vernova. The current technical and institutional positioning for GE Aerospace adds a new dimension, with traders advised to monitor the $331.66 support level as a potential pivot for short-term direction.






Latest General Electric News





-
 Afghanistan
-
 Albania
-
 Algeria
-
 Angola
-
 Argentina
-
 Armenia
-
 Australia
-
 Austria
-
 Azerbaijan
-
 Bahamas
-
 Bahrain
-
 Bangladesh
-
 Belarus
-
 Belgium
-
 Bolivia
-
 Botswana
-
 Brazil
-
 Brunei
-
 Bulgaria
-
 Cambodia
-
 Cameroon
-
 Canada
-
 Chile
-
 China
-
 Colombia
-
 Congo
-
 Costa Rica
-
 Cote d'Ivoire
-
 Croatia
-
 Cuba
-
 Cyprus
-
 Czechia
-
 DR Congo
-
 Denmark
-
 Dominican Republic
-
 Ecuador
-
 Egypt
-
 El Salvador
-
 Estonia
-
 Eswatini
-
 Ethiopia
-
 Finland
-
 France
-
 Georgia
-
 Germany
-
 Ghana
-
 Greece
-
 Haiti
-
 Hong Kong
-
 Hungary
-
 India
-
 Indonesia
-
 Iran, Islamic republic
-
 Iraq
-
 Ireland
-
 Israel
-
 Italy
-
 Jamaica
-
 Japan
-
 Jordan
-
 Kazakhstan
-
 Kenya
-
 Korea
-
 Kuwait
-
 Kyrgyzstan
-
 Laos
-
 Latvia
-
 Lebanon
-
 Lesotho
-
 Libya
-
 Lithuania
-
 Luxembourg
-
 Madagascar
-
 Malaysia
-
 Malta
-
 Mauritius
-
 Mexico
-
 Moldova
-
 Mongolia
-
 Montenegro
-
 Morocco
-
 Mozambique
-
 Myanmar
-
 Namibia
-
 Nepal
-
 Netherlands
-
 New Zealand
-
 Nigeria
-
 North Macedonia
-
 Norway
-
 Oman
-
 Pakistan
-
 Palestine
-
 Panama
-
 Papua New Guinea
-
 Paraguay
-
 Peru
-
 Philippines
-
 Poland
-
 Portugal
-
 Puerto Rico
-
 Qatar
-
 Reunion
-
 Romania
-
 Rwanda
-
 Saudi Arabia
-
 Serbia
-
 Singapore
-
 Slovakia
-
 Slovenia
-
 Somalia
-
 South Africa
-
 Spain
-
 Sri Lanka
-
 Sweden
-
 Switzerland
-
 Syria
-
 Taiwan
-
 Tajikistan
-
 Tanzania
-
 Thailand
-
 Trinidad and Tobago
-
 Tunisia
-
 Turkey
-
 UAE
-
 Uganda
-
 Ukraine
-
 United Kingdom
-
United States
-
 Uruguay
-
 Uzbekistan
-
 Venezuela
-
 Vietnam
-
 Yemen
-
 Zambia
-
 Zimbabwe
- Forex
- Crypto












