

What's behind Vodafone's latest 1.5% stock pullback?

Vodafone Group plc (VOD) dropped 1.52% after ongoing selling pressure resurfaced, driven by the latest earnings results from its Vodafone Idea subsidiary pointing to persistent challenges. The move is supported by Vodafone trading below its 20-day and 50-day moving averages, signaling a continuation of near-term and medium-term weakness.
 117.10
118.65
Highlights
- Vodafone Idea reported a consolidated net loss of ₹5,975 crore for Q2 FY27, up from ₹5,524 crore the previous year.
- Revenue grew by 1.7% year over year as average revenue per user rose to ₹198 with a subscriber base of 194.4 million.
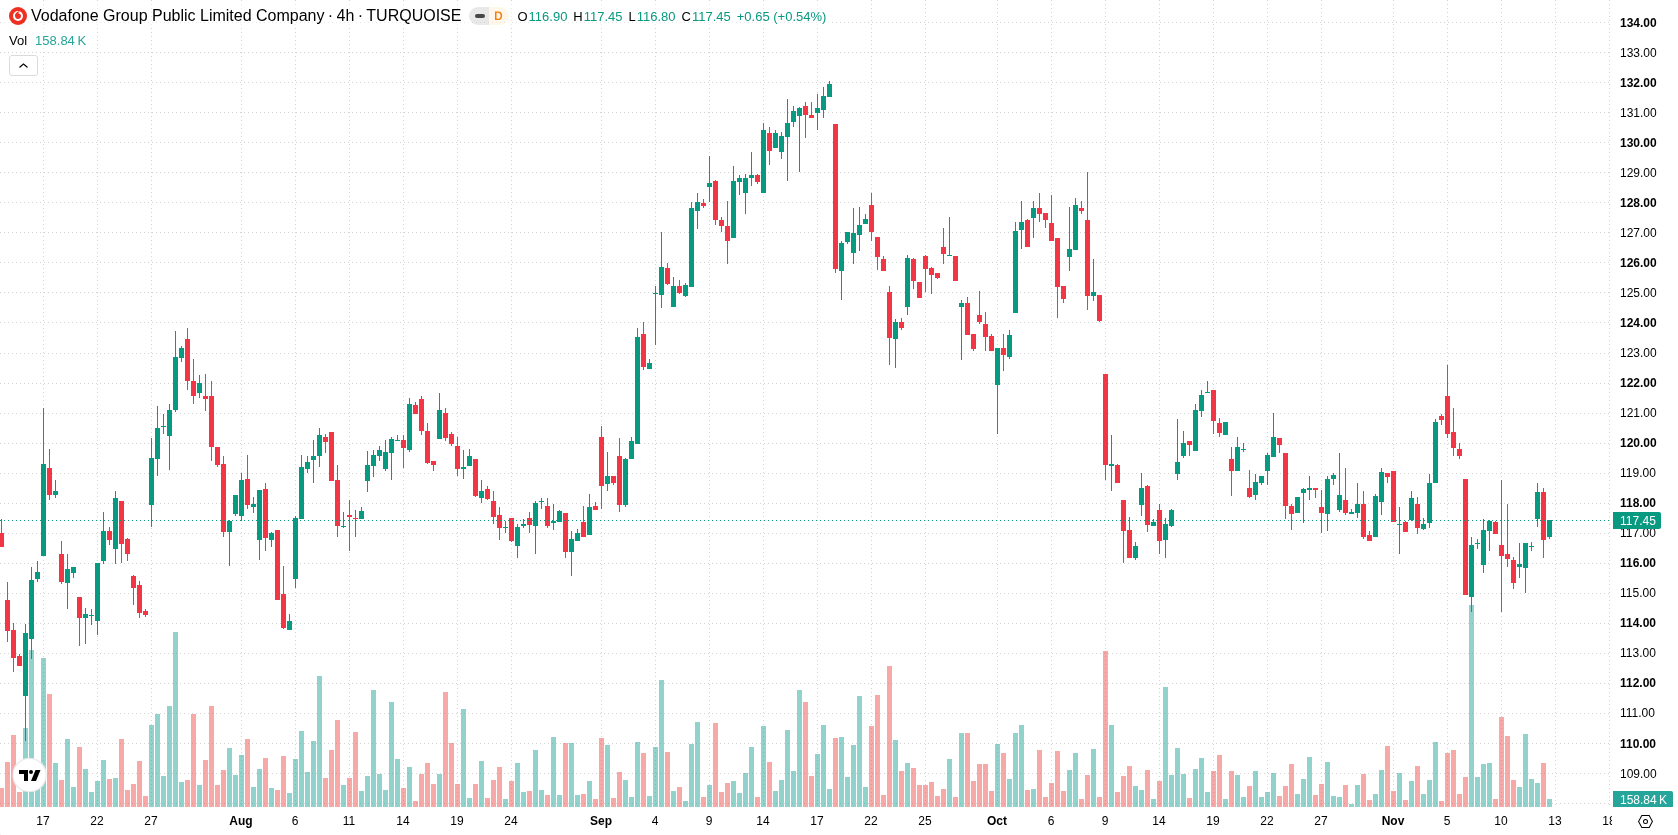
- Shares of Vodafone trade below key near-term moving averages and are expected to oscillate between GBX114.13 and GBX118.38, with bearish momentum prevailing.
Net loss widens as one-off costs and negative asset revaluations weigh
Vodafone Idea, a subsidiary in which Vodafone Group holds a stake, reported a widened consolidated net loss of ₹5,975 crore for Q2 FY27, compared to ₹5,524 crore a year earlier. The increase in losses was mainly attributed to an exceptional item related to the remeasurement of settlement assets connected to Vodafone Group entities and negative mark-to-market adjustments on treasury assets. Despite these pressures, Vodafone Idea recorded a 1.7% annual growth in revenue, with average revenue per user rising to ₹198 and the subscriber base reaching 194.4 million. Capital expenditure more than doubled sequentially with significant future network expansion orders, though price action has remained under broader selling pressure.
Mixed momentum signals as short-term weakness contrasts with long-term support
Vodafone is currently trading below both the 20-day and 50-day moving averages at GBX118.47 and GBX122.55, but remains above the 200-day moving average at GBX115.51. This setup points to ongoing near-term and medium-term pressure, although the long-term trend is still viewed as positive based on the MA-50 vs MA-200 alignment. The nearest resistance stands at GBX118.38 and the immediate support is at today's low of GBX116.1. Momentum signals remain mixed: MACD and Awesome Oscillator show bearish momentum, while the ADX is neutral at 15.13. RSI, Stochastic RSI, and CCI stay within neutral zones. Bull/Bear Power is positive, indicating intraday buyer dominance, but price action near the daily low and intraday volatility of 2.24% reflect persistent selling pressure through the session.
Earlier, analysts noted that Vodafone was expected to remain in a consolidative phase, with downside risks dominating its short-term technical outlook. The latest breakdown below key moving averages and renewed selling pressure following Vodafone Idea’s disappointing results underscore a heightened risk of further downside, making GBX114.13 a critical support level to monitor in the coming sessions.










-
 Afghanistan
-
 Albania
-
 Algeria
-
 Angola
-
 Argentina
-
 Armenia
-
 Australia
-
 Austria
-
 Azerbaijan
-
 Bahamas
-
 Bahrain
-
 Bangladesh
-
 Belarus
-
 Belgium
-
 Bolivia
-
 Botswana
-
 Brazil
-
 Brunei
-
 Bulgaria
-
 Cambodia
-
 Cameroon
-
 Canada
-
 Chile
-
 China
-
 Colombia
-
 Congo
-
 Costa Rica
-
 Cote d'Ivoire
-
 Croatia
-
 Cuba
-
 Cyprus
-
 Czechia
-
 DR Congo
-
 Denmark
-
 Dominican Republic
-
 Ecuador
-
 Egypt
-
 El Salvador
-
 Estonia
-
 Eswatini
-
 Ethiopia
-
 Finland
-
 France
-
 Georgia
-
 Germany
-
 Ghana
-
 Greece
-
 Haiti
-
 Hong Kong
-
 Hungary
-
 India
-
 Indonesia
-
 Iran, Islamic republic
-
 Iraq
-
 Ireland
-
 Israel
-
 Italy
-
 Jamaica
-
 Japan
-
 Jordan
-
 Kazakhstan
-
 Kenya
-
 Korea
-
 Kuwait
-
 Kyrgyzstan
-
 Laos
-
 Latvia
-
 Lebanon
-
 Lesotho
-
 Libya
-
 Lithuania
-
 Luxembourg
-
 Madagascar
-
 Malaysia
-
 Malta
-
 Mauritius
-
 Mexico
-
 Moldova
-
 Mongolia
-
 Montenegro
-
 Morocco
-
 Mozambique
-
 Myanmar
-
 Namibia
-
 Nepal
-
 Netherlands
-
 New Zealand
-
 Nigeria
-
 North Macedonia
-
 Norway
-
 Oman
-
 Pakistan
-
 Palestine
-
 Panama
-
 Papua New Guinea
-
 Paraguay
-
 Peru
-
 Philippines
-
 Poland
-
 Portugal
-
 Puerto Rico
-
 Qatar
-
 Reunion
-
 Romania
-
 Rwanda
-
 Saudi Arabia
-
 Serbia
-
 Singapore
-
 Slovakia
-
 Slovenia
-
 Somalia
-
 South Africa
-
 Spain
-
 Sri Lanka
-
 Sweden
-
 Switzerland
-
 Syria
-
 Taiwan
-
 Tajikistan
-
 Tanzania
-
 Thailand
-
 Trinidad and Tobago
-
 Tunisia
-
 Turkey
-
 UAE
-
 Uganda
-
 Ukraine
-
 United Kingdom
-
United States
-
 Uruguay
-
 Uzbekistan
-
 Venezuela
-
 Vietnam
-
 Yemen
-
 Zambia
-
 Zimbabwe
- Forex
- Crypto












