

Telus shares technical analysis: Consolidation near C$12.39 resistance with neutral signals

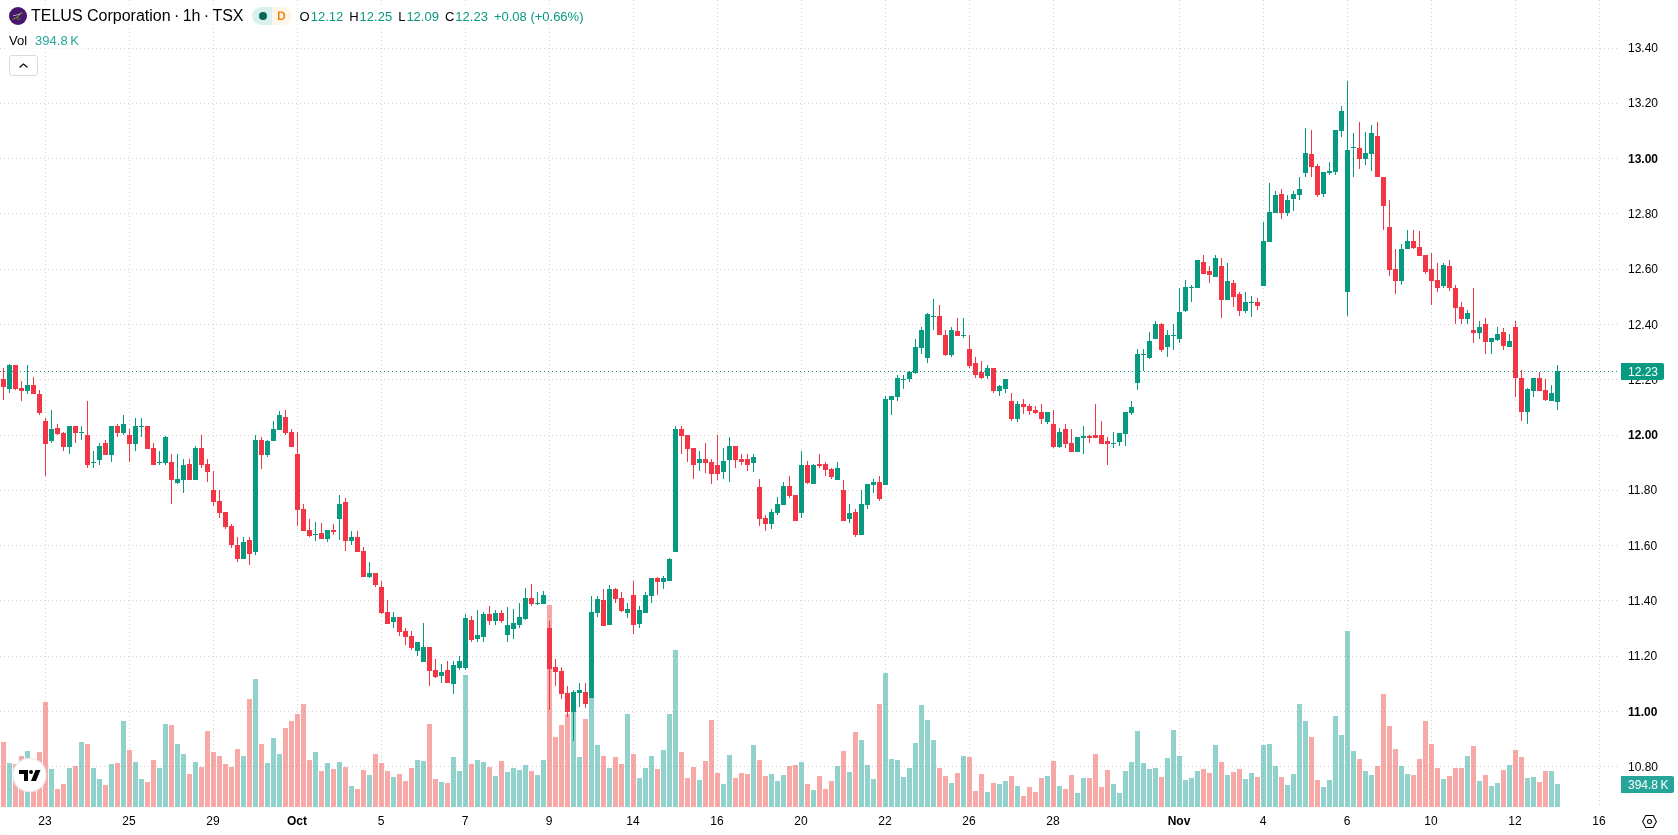
Telus (T) stock is trading at C$12.25, posting modest intraday gains of 0.82%. The price sits near the top of today’s range and is positioned below its key moving averages.
 12.30
12.84
Highlights
- Telus free cash flow dropped 35% year over year to $396 million in the third quarter of 2026.
- Adjusted EBITDA fell 5% to $1.8 billion and adjusted earnings per share declined to $0.16, showing ongoing margin pressure.
- Telus stock trades below key moving averages with weak momentum, expected to fluctuate between C$11.9 to C$12.6 in coming sessions.
Earnings pressure and cash flow drop drive cost-cutting measures
In the third quarter of 2026, Telus reported that free cash flow fell 35% year over year to $396 million, highlighting ongoing challenges in generating operating liquidity. According to Fool, adjusted EBITDA declined 5% to $1.8 billion, while adjusted earnings per share dropped from $0.24 to $0.16, both reflecting margin pressure and underlying earnings headwinds. In response, the company has enacted a $900 million savings plan intended to address the cost base and support future performance.
Multi-timeframe sell momentum as key resistance holds recovery
On the hourly chart, T is trading below both the MA-20 and MA-50, and remains well below the MA-200, indicating sustained downward momentum across multiple timeframes. The Ichimoku Kijun line at C$12.39 serves as immediate resistance for any potential recovery attempts. MACD and ADX both indicate a continued sell bias, while RSI and Stochastic RSI are neutral, signaling indecision among short-term momentum traders. CCI is in oversold territory, pointing to possible seller exhaustion, but Bull/Bear Power remains slightly negative and confirms lingering intraday downside pressure.
Sideways trade favored as downside risk narrowly outpaces rebound odds
For the next several sessions, T is likely to remain bound within the C$11.9 to C$12.6 volatility band relative to current levels. The baseline scenario favors sideways consolidation within this range. A move above C$12.39 resistance could prompt additional short-term gains, while a breakdown below C$11.9 support may open the door to further declines. Current technicals assign a 55% chance to further downside, with a 45% probability of an upward move.
Earlier, analysts noted that TELUS was under sustained selling pressure driven by operational headwinds and asset impairments, leading to cautious outlooks. The current analysis confirms persistent technical weakness and margin challenges, with consolidation likely to persist and a break of either C$12.39 resistance or C$11.9 support now set to define the next directional move.






Latest Telus News




-
 Afghanistan
-
 Albania
-
 Algeria
-
 Angola
-
 Argentina
-
 Armenia
-
 Australia
-
 Austria
-
 Azerbaijan
-
 Bahamas
-
 Bahrain
-
 Bangladesh
-
 Belarus
-
 Belgium
-
 Bolivia
-
 Botswana
-
 Brazil
-
 Brunei
-
 Bulgaria
-
 Cambodia
-
 Cameroon
-
 Canada
-
 Chile
-
 China
-
 Colombia
-
 Congo
-
 Costa Rica
-
 Cote d'Ivoire
-
 Croatia
-
 Cuba
-
 Cyprus
-
 Czechia
-
 DR Congo
-
 Denmark
-
 Dominican Republic
-
 Ecuador
-
 Egypt
-
 El Salvador
-
 Estonia
-
 Eswatini
-
 Ethiopia
-
 Finland
-
 France
-
 Georgia
-
 Germany
-
 Ghana
-
 Greece
-
 Haiti
-
 Hong Kong
-
 Hungary
-
 India
-
 Indonesia
-
 Iran, Islamic republic
-
 Iraq
-
 Ireland
-
 Israel
-
 Italy
-
 Jamaica
-
 Japan
-
 Jordan
-
 Kazakhstan
-
 Kenya
-
 Korea
-
 Kuwait
-
 Kyrgyzstan
-
 Laos
-
 Latvia
-
 Lebanon
-
 Lesotho
-
 Libya
-
 Lithuania
-
 Luxembourg
-
 Madagascar
-
 Malaysia
-
 Malta
-
 Mauritius
-
 Mexico
-
 Moldova
-
 Mongolia
-
 Montenegro
-
 Morocco
-
 Mozambique
-
 Myanmar
-
 Namibia
-
 Nepal
-
 Netherlands
-
 New Zealand
-
 Nigeria
-
 North Macedonia
-
 Norway
-
 Oman
-
 Pakistan
-
 Palestine
-
 Panama
-
 Papua New Guinea
-
 Paraguay
-
 Peru
-
 Philippines
-
 Poland
-
 Portugal
-
 Puerto Rico
-
 Qatar
-
 Reunion
-
 Romania
-
 Rwanda
-
 Saudi Arabia
-
 Serbia
-
 Singapore
-
 Slovakia
-
 Slovenia
-
 Somalia
-
 South Africa
-
 Spain
-
 Sri Lanka
-
 Sweden
-
 Switzerland
-
 Syria
-
 Taiwan
-
 Tajikistan
-
 Tanzania
-
 Thailand
-
 Trinidad and Tobago
-
 Tunisia
-
 Turkey
-
 UAE
-
 Uganda
-
 Ukraine
-
 United Kingdom
-
United States
-
 Uruguay
-
 Uzbekistan
-
 Venezuela
-
 Vietnam
-
 Yemen
-
 Zambia
-
 Zimbabwe
- Forex
- Crypto












