

CLSK slides around 5.5% as bearish momentum signals and downside risk pressure price lower

Weak technical momentum and sustained selling pressure drove CleanSpark, Inc. (CLSK) lower by 5.45% today. The decline is reinforced by the stock trading below all key moving averages, highlighting ongoing downside risk.
 6.77
7.35
Highlights
- Shares of CleanSpark fell 5.45% to $6.46, trading near the session low with intraday volatility at 12.56%.
- The price remains below key moving averages, with technical indicators confirming bearish momentum and elevated downside risk.
- Forecast range for the next 5 sessions is $5.82 to $7.19, with over 80% probability of a move lower.
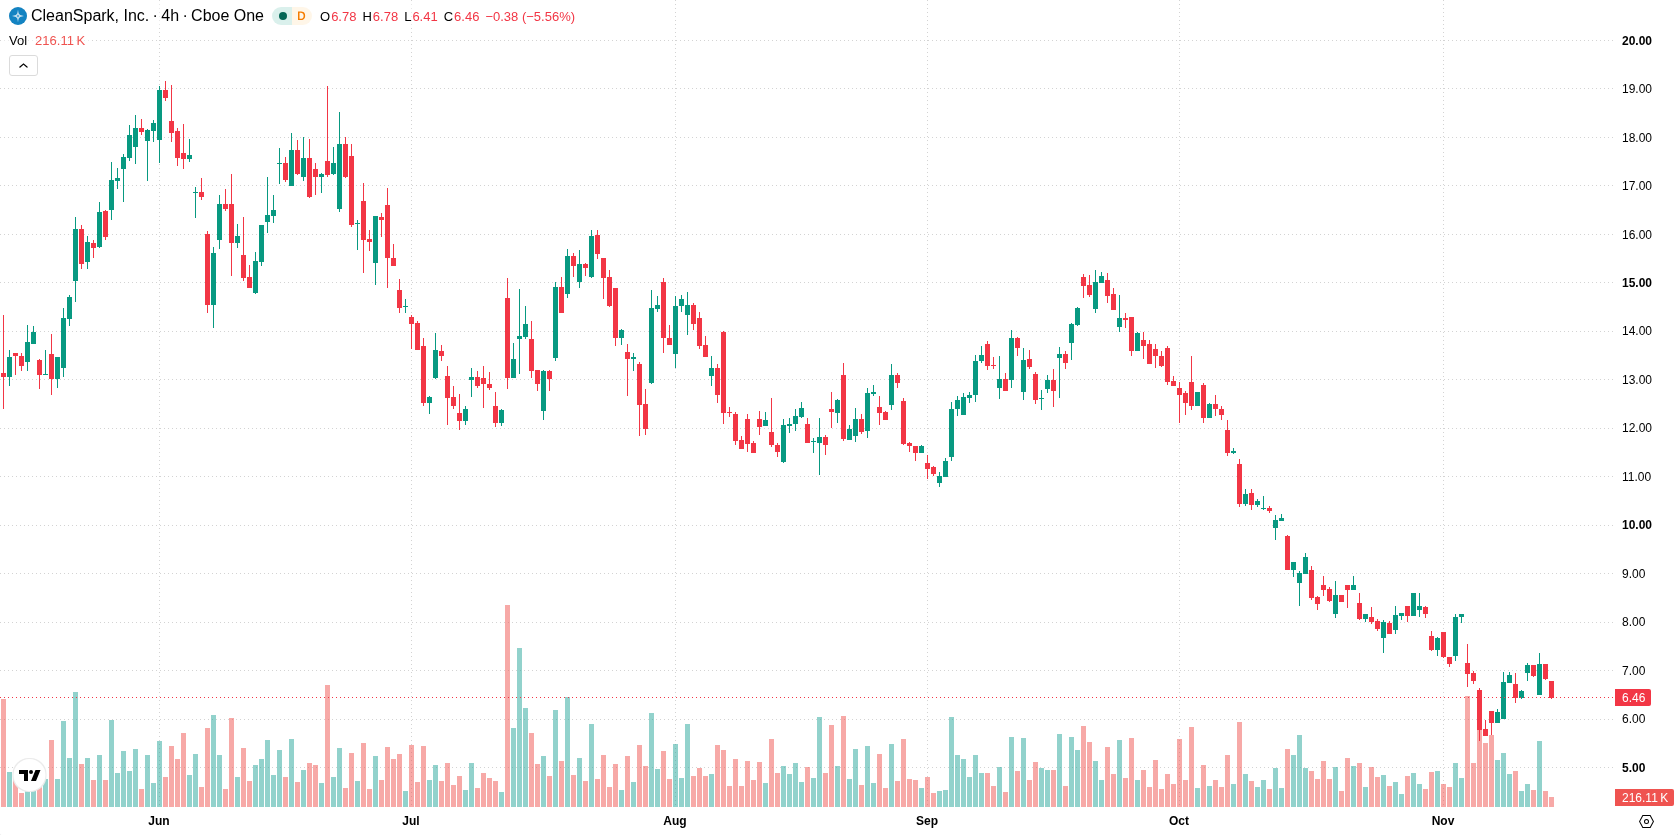
Bearish signals dominate as major averages and momentum indicators align
CleanSpark is trading below the 20-day, 50-day, and 200-day moving averages ($7.58, $10.61, and $12.06), indicating sustained pressure from sellers in the short, medium, and long term. Immediate technical resistance is at the near-term ceiling of $6.53, while near-term floor support sits at $6.07. Momentum indicators show bearish conditions, with both MACD and Average Directional Index (ADX) generating strong sell signals. The Relative Strength Index (RSI) and Commodity Channel Index (CCI) are both neutral, while Stochastic RSI is in the overbought zone, signaling potential downside correction risk specific to this oscillator. Bull/Bear Power (BBP) marginally favors buyers intraday, but the daily move is lower, with the stock currently at $6.46, down 5.45% after opening with a downside gap of around 4.39%. Price is near the session low, and intraday volatility stands at 12.56%, reflecting persistent selling pressure since the open and a tone of weakness. There is a divergence between price action and BBP's mild buyer dominance, but momentum indicators confirm a bearish setup.
Earlier, analysts noted that CleanSpark's technical outlook was characterized by short-term momentum above key moving averages, tempered by ongoing range-bound risks. The latest breakdown below all major moving averages and confirmation from bearish momentum indicators marks a shift to decisive downside risk, with a critical area to watch being the $6.07 floor for any signs of stabilization.






Latest CleanSpark News



-
 Afghanistan
-
 Albania
-
 Algeria
-
 Angola
-
 Argentina
-
 Armenia
-
 Australia
-
 Austria
-
 Azerbaijan
-
 Bahamas
-
 Bahrain
-
 Bangladesh
-
 Belarus
-
 Belgium
-
 Bolivia
-
 Botswana
-
 Brazil
-
 Brunei
-
 Bulgaria
-
 Cambodia
-
 Cameroon
-
 Canada
-
 Chile
-
 China
-
 Colombia
-
 Congo
-
 Costa Rica
-
 Cote d'Ivoire
-
 Croatia
-
 Cuba
-
 Cyprus
-
 Czechia
-
 DR Congo
-
 Denmark
-
 Dominican Republic
-
 Ecuador
-
 Egypt
-
 El Salvador
-
 Estonia
-
 Eswatini
-
 Ethiopia
-
 Finland
-
 France
-
 Georgia
-
 Germany
-
 Ghana
-
 Greece
-
 Haiti
-
 Hong Kong
-
 Hungary
-
 India
-
 Indonesia
-
 Iran, Islamic republic
-
 Iraq
-
 Ireland
-
 Israel
-
 Italy
-
 Jamaica
-
 Japan
-
 Jordan
-
 Kazakhstan
-
 Kenya
-
 Korea
-
 Kuwait
-
 Kyrgyzstan
-
 Laos
-
 Latvia
-
 Lebanon
-
 Lesotho
-
 Libya
-
 Lithuania
-
 Luxembourg
-
 Madagascar
-
 Malaysia
-
 Malta
-
 Mauritius
-
 Mexico
-
 Moldova
-
 Mongolia
-
 Montenegro
-
 Morocco
-
 Mozambique
-
 Myanmar
-
 Namibia
-
 Nepal
-
 Netherlands
-
 New Zealand
-
 Nigeria
-
 North Macedonia
-
 Norway
-
 Oman
-
 Pakistan
-
 Palestine
-
 Panama
-
 Papua New Guinea
-
 Paraguay
-
 Peru
-
 Philippines
-
 Poland
-
 Portugal
-
 Puerto Rico
-
 Qatar
-
 Reunion
-
 Romania
-
 Rwanda
-
 Saudi Arabia
-
 Serbia
-
 Singapore
-
 Slovakia
-
 Slovenia
-
 Somalia
-
 South Africa
-
 Spain
-
 Sri Lanka
-
 Sweden
-
 Switzerland
-
 Syria
-
 Taiwan
-
 Tajikistan
-
 Tanzania
-
 Thailand
-
 Trinidad and Tobago
-
 Tunisia
-
 Turkey
-
 UAE
-
 Uganda
-
 Ukraine
-
 United Kingdom
-
United States
-
 Uruguay
-
 Uzbekistan
-
 Venezuela
-
 Vietnam
-
 Yemen
-
 Zambia
-
 Zimbabwe
- Forex
- Crypto












