

S&P 500 falls over 1% as selling pressure and cautious trading weigh ahead of inflation data

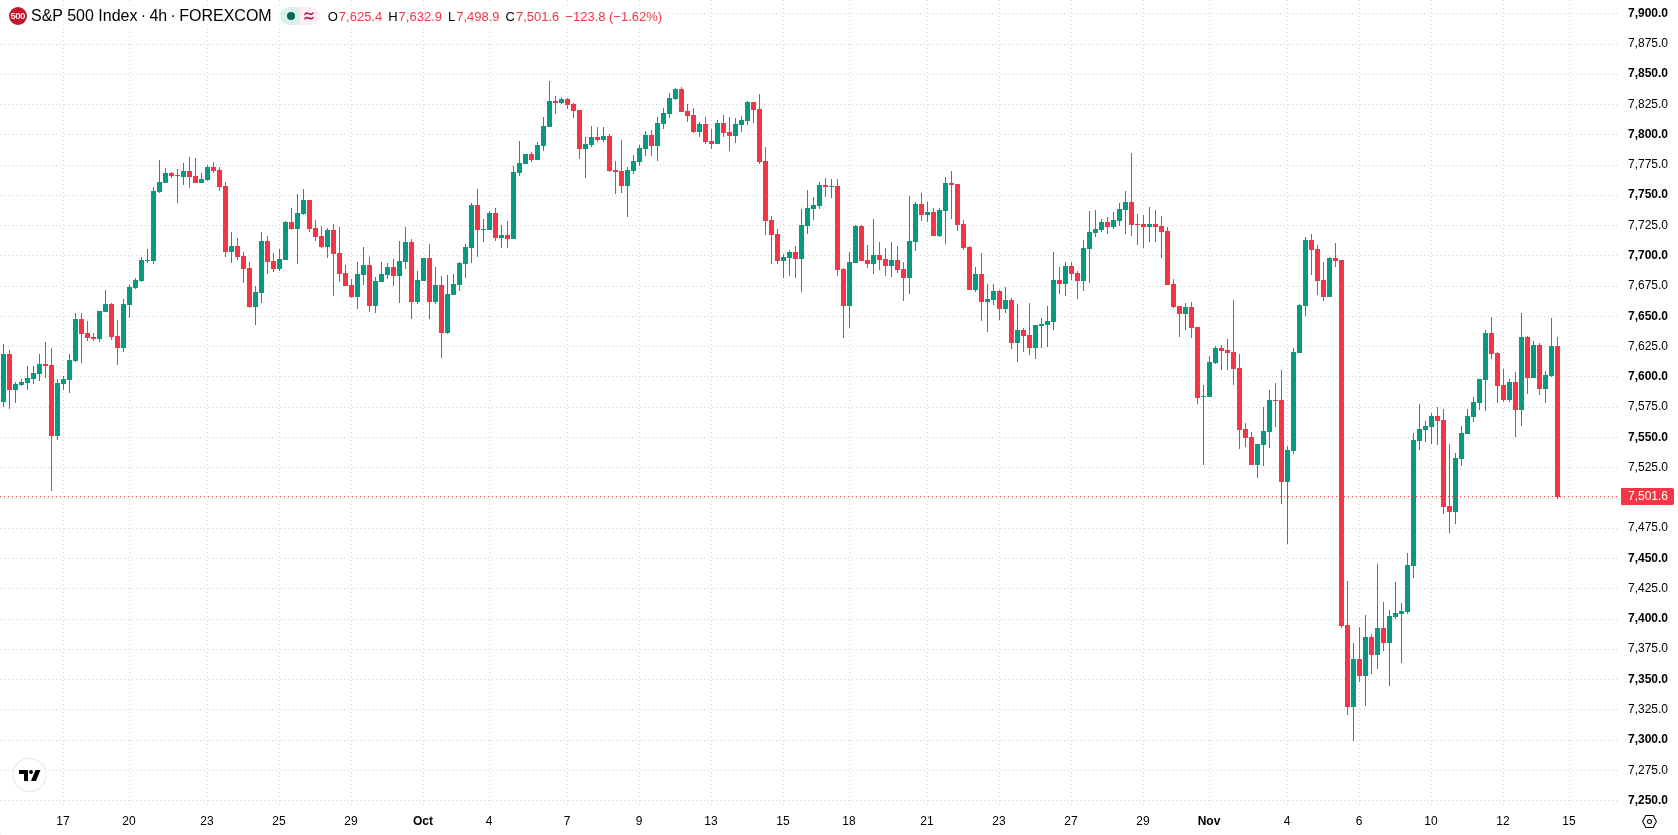
S&P 500 Index (SPX) dropped 1.08% after cautious trading prevailed amid a lack of fresh macroeconomic drivers and an uncertain outlook ahead of inflation data releases. The move is supported by persistent short- and medium-term selling pressure as the index continues to trade below its 20-day and 50-day moving averages.
 7617.27
7649.65
Highlights
- Goldman Sachs projected that S&P 500 valuations look more attractive after the recent market selloff.
- Investors are tracking effects from Nvidia's leadership change and watching producer price inflation data with ongoing selling pressure in major ETFs.
- The S&P 500 trades below short-term averages with negative momentum, a five-day expected range of 7,373 to 7,646, and a 59% probability of further downside.
Investor caution persists as leadership changes and yields weigh on sentiment
Goldman Sachs projected that valuations in the S&P 500 improved following a recent selloff. Recent sessions saw investors weigh the impact of a leadership change at Nvidia and persistent elevated U.S. Treasury yields, with market focus remaining on upcoming producer price inflation data. Activity was tracked across ETFs such as SPY and IVV as sentiment stayed muted, though price action has remained under broader selling pressure.
Short-term weakness endures with bearish momentum amid muted trend strength
The S&P 500 is trading below its 20-day and 50-day moving averages ($7,617 and $7,671), but remains above its 200-day moving average ($7,337). This structure points to ongoing short- and medium-term weakness from sellers, while the overall longer-term trend remains bullish given the positive setup between the 50-day and 200-day averages. The nearest support is at $7,376, with immediate resistance at $7,558. Additional resistance appears at the Ichimoku Kijun of $7,587. The MACD suggests strong negative momentum, and ADX at 16.38 indicates a lack of significant trend strength. RSI, Stochastic RSI, and CCI are all in neutral zones, showing neither overbought nor oversold extremes. Intraday, the BBP remains positive, reflecting some buyer presence, while volatility is at 1.21% and the index trades near session lows.
Earlier, analysts noted that uncertainty around Nvidia’s leadership and rising energy prices could continue to challenge the S&P 500’s recovery. The current technical picture adds a dimension of near-term caution, with 7,373 emerging as a critical downside level traders should monitor for signs of further weakness.










-
 Afghanistan
-
 Albania
-
 Algeria
-
 Angola
-
 Argentina
-
 Armenia
-
 Australia
-
 Austria
-
 Azerbaijan
-
 Bahamas
-
 Bahrain
-
 Bangladesh
-
 Belarus
-
 Belgium
-
 Bolivia
-
 Botswana
-
 Brazil
-
 Brunei
-
 Bulgaria
-
 Cambodia
-
 Cameroon
-
 Canada
-
 Chile
-
 China
-
 Colombia
-
 Congo
-
 Costa Rica
-
 Cote d'Ivoire
-
 Croatia
-
 Cuba
-
 Cyprus
-
 Czechia
-
 DR Congo
-
 Denmark
-
 Dominican Republic
-
 Ecuador
-
 Egypt
-
 El Salvador
-
 Estonia
-
 Eswatini
-
 Ethiopia
-
 Finland
-
 France
-
 Georgia
-
 Germany
-
 Ghana
-
 Greece
-
 Haiti
-
 Hong Kong
-
 Hungary
-
 India
-
 Indonesia
-
 Iran, Islamic republic
-
 Iraq
-
 Ireland
-
 Israel
-
 Italy
-
 Jamaica
-
 Japan
-
 Jordan
-
 Kazakhstan
-
 Kenya
-
 Korea
-
 Kuwait
-
 Kyrgyzstan
-
 Laos
-
 Latvia
-
 Lebanon
-
 Lesotho
-
 Libya
-
 Lithuania
-
 Luxembourg
-
 Madagascar
-
 Malaysia
-
 Malta
-
 Mauritius
-
 Mexico
-
 Moldova
-
 Mongolia
-
 Montenegro
-
 Morocco
-
 Mozambique
-
 Myanmar
-
 Namibia
-
 Nepal
-
 Netherlands
-
 New Zealand
-
 Nigeria
-
 North Macedonia
-
 Norway
-
 Oman
-
 Pakistan
-
 Palestine
-
 Panama
-
 Papua New Guinea
-
 Paraguay
-
 Peru
-
 Philippines
-
 Poland
-
 Portugal
-
 Puerto Rico
-
 Qatar
-
 Reunion
-
 Romania
-
 Rwanda
-
 Saudi Arabia
-
 Serbia
-
 Singapore
-
 Slovakia
-
 Slovenia
-
 Somalia
-
 South Africa
-
 Spain
-
 Sri Lanka
-
 Sweden
-
 Switzerland
-
 Syria
-
 Taiwan
-
 Tajikistan
-
 Tanzania
-
 Thailand
-
 Trinidad and Tobago
-
 Tunisia
-
 Turkey
-
 UAE
-
 Uganda
-
 Ukraine
-
 United Kingdom
-
United States
-
 Uruguay
-
 Uzbekistan
-
 Venezuela
-
 Vietnam
-
 Yemen
-
 Zambia
-
 Zimbabwe
- Forex
- Crypto












