

Robinhood shares technical analysis: Seller pressure keeps downside risk in focus

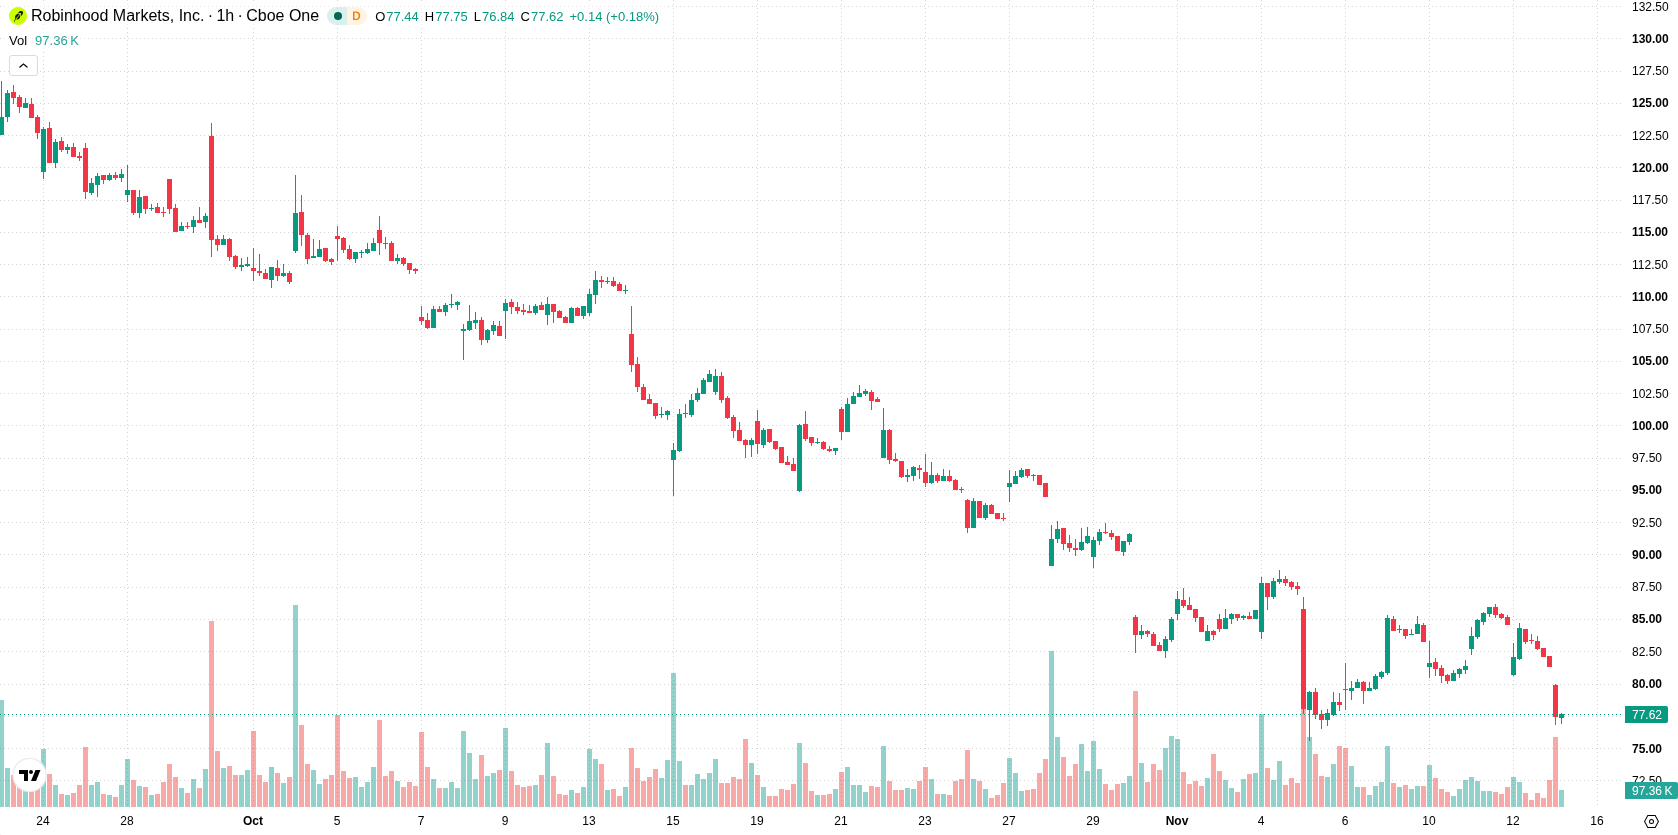
Robinhood (HOOD) stock is trading at $77.4, down 4.84% on the day. The price currently sits below its key moving averages, reflecting a strong downside move alongside intraday volatility.
 79.76
86.09
Highlights
- Robinhood reported record October 2026 revenues at $1.4 billion, up 12% year over year, with increased funded accounts and margin balances.
- Securities-lending revenues fell 43% and expanding event contract trading now faces legal scrutiny from the Louisiana Attorney General.
- Shares of Robinhood fell 4.84% to $77.4, trading below major moving averages with persistent selling and a projected range of $74.7 to $82.57.
Operational gains offset by legal scrutiny and income headwinds
Robinhood Markets, Inc. reported record operating results for October 2026, with revenues rising 12% year over year to $1.4 billion alongside substantial growth in funded customer accounts and margin balances, according to Globenewswire and Yahoo Finance. While these operational metrics underscore a broadening business scale, a 43% drop in securities-lending revenues signals pressure on certain income streams, and expanding event contract trading volumes, though now a larger revenue contributor than crypto or stock, are facing increased legal scrutiny after the Louisiana Attorney General filed a lawsuit over these offerings, as reported by The Block. Robinhood has also moved to expand its IPO Access service to UK retail investors, enabling broader participation in new U.S. listings, as noted by Crowdfundinsider. Overall, fresh operational and product successes have been tempered by mounting regulatory challenges, with sentiment constrained by enforcement actions in the nontraditional trading segment.
Technical weakness prevails amid mixed short-term signals
HOOD trades below the MA-20, MA-50, and MA-200, confirming downside pressure across multiple timeframes. Immediate resistance is defined by the Ichimoku Kijun at $83.06. On the technical indicator front, RSI and CCI remain neutral, while Stoch RSI is positioned in the oversold zone, signaling some potential for a short-lived bounce. MACD, ADX, and the Awesome Oscillator are all neutral, while Bull/Bear Power reads at -0.91, reflecting ongoing seller dominance. These mixed signals illustrate prevailing weakness, though some indicators point to possible short-term exhaustion.
Sideways trade likely amid high volatility and bearish risks
Barring a decisive move past $83.06, the price is expected to remain volatile within a range of $74.7 to $82.57 over the next several days. The probability of an upward breakout is considered very low, while downside risk is high; a rebound is unlikely unless key resistance is cleared. Should HOOD breach support in the $74.7 area, further declines could follow, while a bounce would require rapid momentum reversal and a close above immediate resistance. The base case anticipates sideways trading within the established volatility band.
Earlier, analysts noted that Robinhood was under downside pressure as weak technical momentum overshadowed operational and product developments. The current analysis strengthens this caution by highlighting ongoing technical vulnerability amid new regulatory headwinds, with the $74.7 support level emerging as a critical threshold for risk management.










-
 Afghanistan
-
 Albania
-
 Algeria
-
 Angola
-
 Argentina
-
 Armenia
-
 Australia
-
 Austria
-
 Azerbaijan
-
 Bahamas
-
 Bahrain
-
 Bangladesh
-
 Belarus
-
 Belgium
-
 Bolivia
-
 Botswana
-
 Brazil
-
 Brunei
-
 Bulgaria
-
 Cambodia
-
 Cameroon
-
 Canada
-
 Chile
-
 China
-
 Colombia
-
 Congo
-
 Costa Rica
-
 Cote d'Ivoire
-
 Croatia
-
 Cuba
-
 Cyprus
-
 Czechia
-
 DR Congo
-
 Denmark
-
 Dominican Republic
-
 Ecuador
-
 Egypt
-
 El Salvador
-
 Estonia
-
 Eswatini
-
 Ethiopia
-
 Finland
-
 France
-
 Georgia
-
 Germany
-
 Ghana
-
 Greece
-
 Haiti
-
 Hong Kong
-
 Hungary
-
 India
-
 Indonesia
-
 Iran, Islamic republic
-
 Iraq
-
 Ireland
-
 Israel
-
 Italy
-
 Jamaica
-
 Japan
-
 Jordan
-
 Kazakhstan
-
 Kenya
-
 Korea
-
 Kuwait
-
 Kyrgyzstan
-
 Laos
-
 Latvia
-
 Lebanon
-
 Lesotho
-
 Libya
-
 Lithuania
-
 Luxembourg
-
 Madagascar
-
 Malaysia
-
 Malta
-
 Mauritius
-
 Mexico
-
 Moldova
-
 Mongolia
-
 Montenegro
-
 Morocco
-
 Mozambique
-
 Myanmar
-
 Namibia
-
 Nepal
-
 Netherlands
-
 New Zealand
-
 Nigeria
-
 North Macedonia
-
 Norway
-
 Oman
-
 Pakistan
-
 Palestine
-
 Panama
-
 Papua New Guinea
-
 Paraguay
-
 Peru
-
 Philippines
-
 Poland
-
 Portugal
-
 Puerto Rico
-
 Qatar
-
 Reunion
-
 Romania
-
 Rwanda
-
 Saudi Arabia
-
 Serbia
-
 Singapore
-
 Slovakia
-
 Slovenia
-
 Somalia
-
 South Africa
-
 Spain
-
 Sri Lanka
-
 Sweden
-
 Switzerland
-
 Syria
-
 Taiwan
-
 Tajikistan
-
 Tanzania
-
 Thailand
-
 Trinidad and Tobago
-
 Tunisia
-
 Turkey
-
 UAE
-
 Uganda
-
 Ukraine
-
 United Kingdom
-
United States
-
 Uruguay
-
 Uzbekistan
-
 Venezuela
-
 Vietnam
-
 Yemen
-
 Zambia
-
 Zimbabwe
- Forex
- Crypto












